
Agentic Analytics: turning service data into better outcomes
Agentic Analytics: turning service data into better outcomes

On this page
As Zendesk takes on more of the work, and more kinds of work, counting just solved conversations tells us nothing about the outcome of what the platform actually delivered. A customer might need an answer, an employee might need help completing a request, or a Custom Agent might handle part of a business process and all of these work together to solve that question. The work can happen through different interfaces and involve several systems, but we still need to understand whether people reached the outcome they came for.
That is the thread running through my AI Summit series: a platform that can adapt to the work we need it to do and the places where we do that work. Agentic Analytics helps us understand the results, investigate what shaped them and decide how the next interaction could work better. This article is the deep dive into that part of the platform.
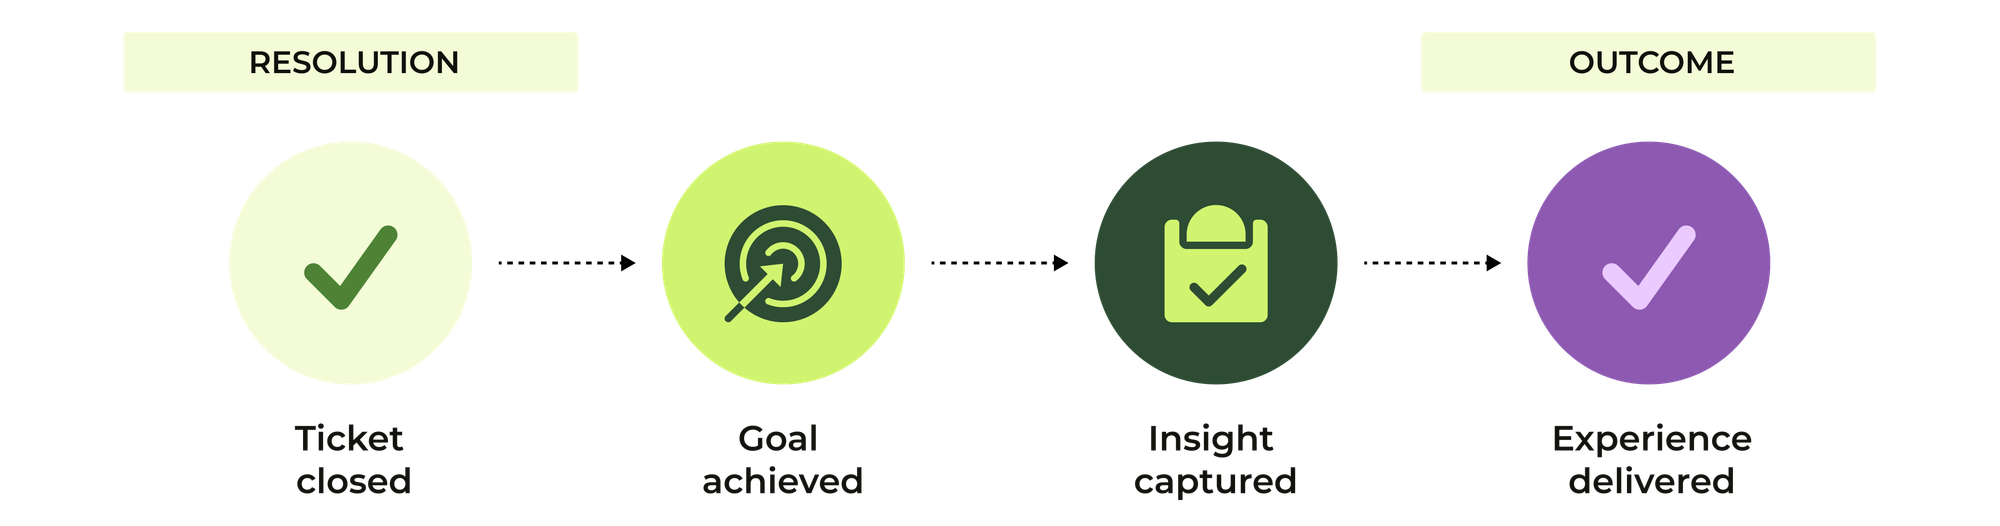
Visibility into what the platform did becomes even more important as AI Agents handle more conversations and business processes. Your team no longer sees every interaction as it unfolds, but still needs to know whether customers are getting useful answers and reaching their intended outcome. A rise in escalations might point to missing knowledge, or to steps in a procedure that need a person. Understanding the difference helps us decide where to spend our time fixing things.
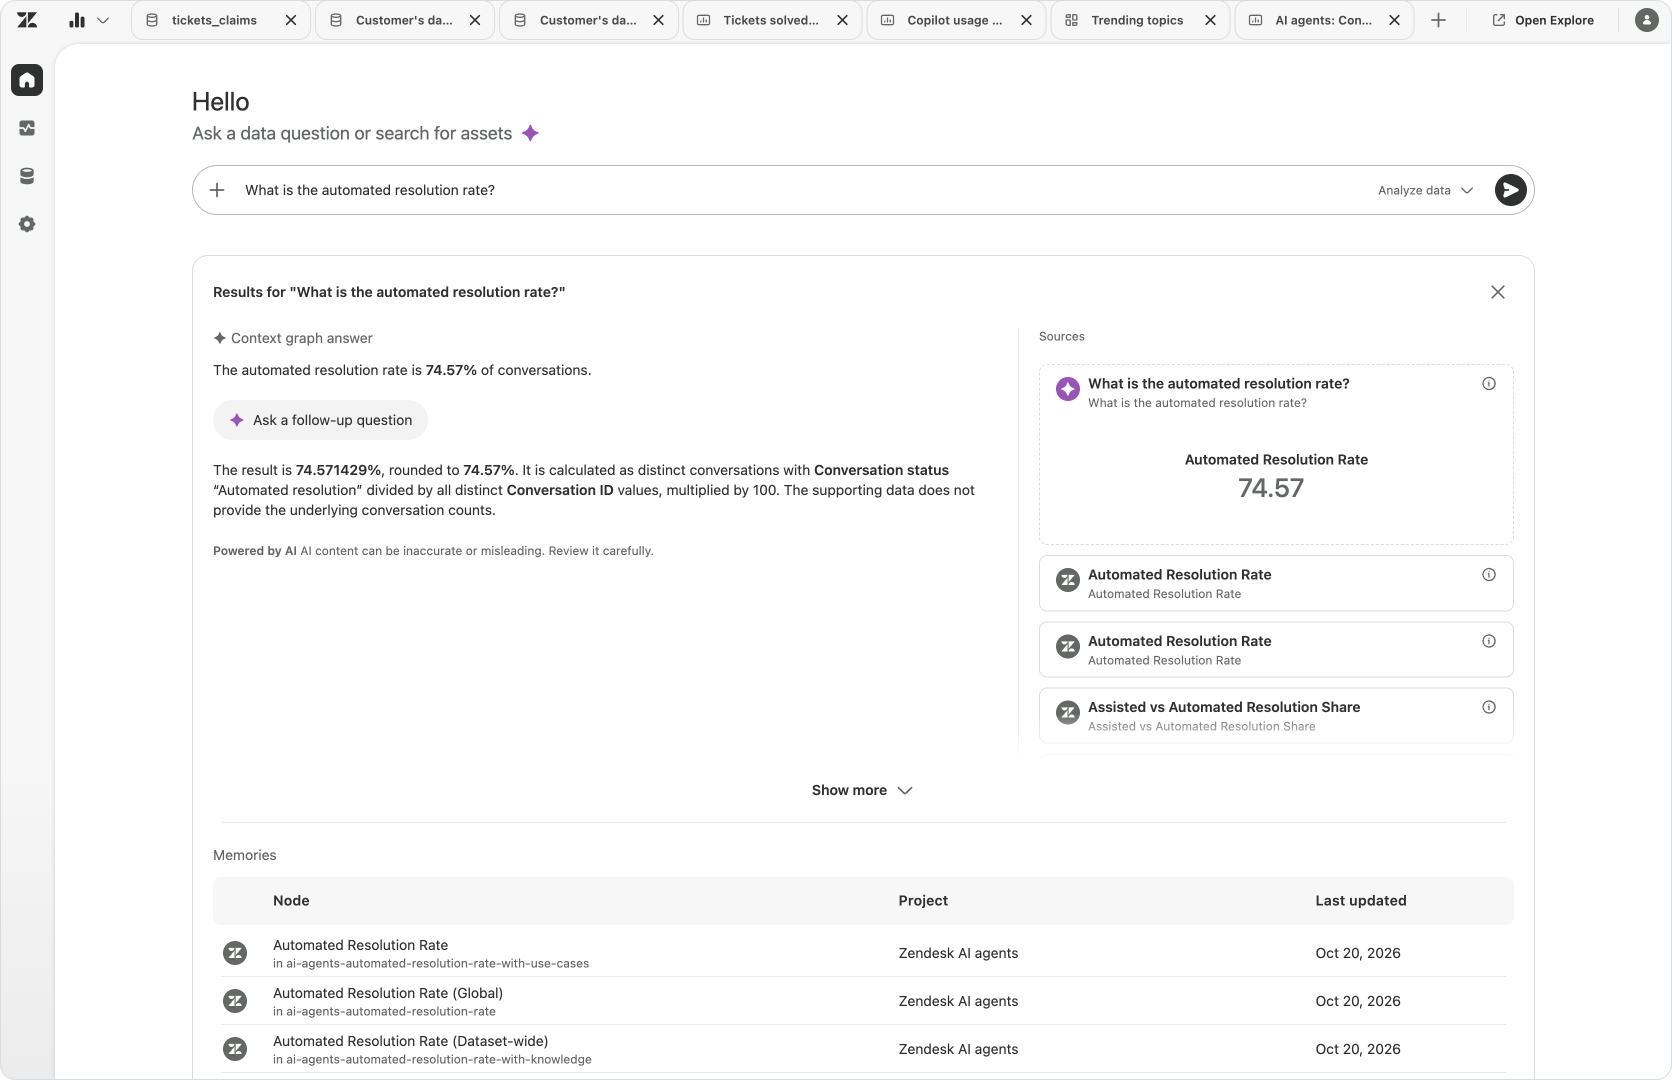
The Agentic Analytics capabilities released at AI Summit bring a broader set of platform data, customisable real-time monitoring and proactive alerts into that investigation. Analyst Copilot lets the people responsible for service explore their data through a conversation, follow up on what they find and keep useful context for the next question. The aim is to make it easier to move from noticing a change to understanding it, and then deciding what to improve.
From dashboards to investigation
For a long time, dashboards have been the main way we look at service data. We build a predefined overview of incoming requests, response times and customer satisfaction metrics and then we return to it on a regular basis to see how the operation is doing. Tools like Explore gave teams a way to follow those measures, but others might fall back to comparing spreadsheets with slightly different filters.
Building that dashboard takes expertise though. Someone needs to understand the datasets, choose the right fields and calculations, and present the result in a way other people can use and understand. After all that work, it is easy to treat the finished dashboard as the goal. We have the numbers, the charts are ready and the report can go out. But for the people running the operation, this is where the next part of the work begins: deciding what those numbers mean for the process and what should change.
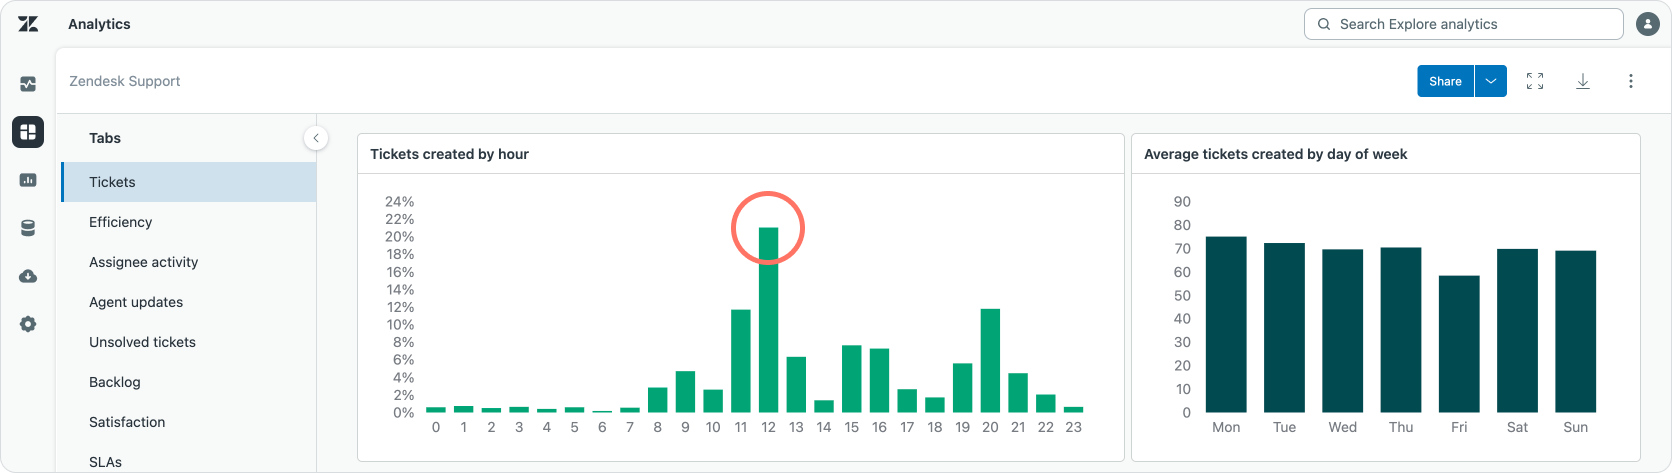
A dashboard can show that claim escalations increased. Understanding if that increase is a good or bad thing is the first question. Why they increased takes further investigation, and deciding if we should do something to change that outcome, and by extension what to do, requires insight about the actual service process.
A well-designed dashboard can help with all three, but its views reflect the questions somebody anticipated when building it. Following a new question might mean changing the report, finding another dataset or asking someone for a different breakdown, diving into the metrics until you find the root cause. The person who understands the customer problem may still depend on someone else to help them investigate it.
With the arrival of AI assistants like Claude or ChatGPT, many people are changing how they approach that work. Instead of learning the reporting tool first, people now export a dataset, or leverage an MCP or API connection to link their assistant to their data. They then ask questions about their data, request a comparison and follow up on an explanation. The conversation can produce the views needed along the way, rather than requiring every view to be designed in advance. That lowers the technical barrier to exploring the data, but it also makes the foundations beneath the answer more important. If we no longer choose every field and calculation ourselves, we need to know that the AI Assistant, or whatever tool we use to talk to our data, understands what those data points mean.
Why the data context matters
In a world of vibe-coding and AI assistants connected to company data, getting a polished dashboard is becoming easier. But getting an insight we can trust still depends on the data behind it. Reliable analytics needs well-defined datasets, agreed metrics and maintained business context. A model can write a correct query and produce a convincing explanation while answering a different question from the one we intended.
An agent that doesn’t understand your business will answer what the user asked, but not what they meant.” - Anthropic
Take a refund claim for example. Do we count it as successful when its ticket is solved, when a decision has been made on the claim or when the received their money? And if the customer leaves a negative CSAT rating, do we still call that a successful outcome? Each of those moments could be treated as the point of resolution, but each choice gives us different numbers and different insights into the experience. The tool needs to know which values to use, what we are measuring and why that definition matters to the business.
This is where Zendesk has a useful starting point compared with a general-purpose AI tool connected to a collection of tables. A ticket already belongs to a service process. Its status, replies, assignment and resolution have meaning within that process, and Zendesk can build service-specific datasets and measures around those relationships. The people using the data can start from that shared understanding rather than having to explain the basic structure of their service operation for every investigation.
Your organisation does need to add the initial context that Zendesk cannot know on its own: what your custom fields mean, how your claims process works and what counts as a successful outcome for your customers. Those definitions still need someone to establish and maintain them. Combining Zendesk's understanding of service with your business definitions gives you a more reliable starting point, without asking each analyst to reconstruct the meaning of the data before they can use it. That is the foundation for making conversational analytics really work.
Understanding those outcomes brings us to four practical problems: finding the data, getting the right numbers, understanding what those numbers mean, and deciding what to change. They need different kinds of work, even when they happen in the same investigation. Looking at Agentic Analytics through those problems makes it easier to see where it helps and where our own knowledge of the business still matters.

Find the data and bring it together
Reporting for CX used to mean counting tickets and the time it took your team to act on them, then combining those records with CSAT. But that dataset is no longer enough. With AI Agents handling more work and Agent Copilot assisting your team, a request now spans a broader set of data. It might begin with an AI Agent, pass to your team and end with feedback or quality signals. Knowledge, procedures and actions taken elsewhere on the platform help explain the journey, while Custom Objects and user data add business context beyond the ticket itself.
Agentic Analytics brings an expanding set of platform data into a shared analytical environment. As more sources become available, we can investigate more of the work happening across Zendesk, using the datasets that support the question at hand. Preparing a dataset once gives the people using it a consistent starting point, without asking each person to find the same information or reconstruct its relationships. The dataset defines which records belong together and makes the relevant fields available for the questions that follow.
Predefined datasets
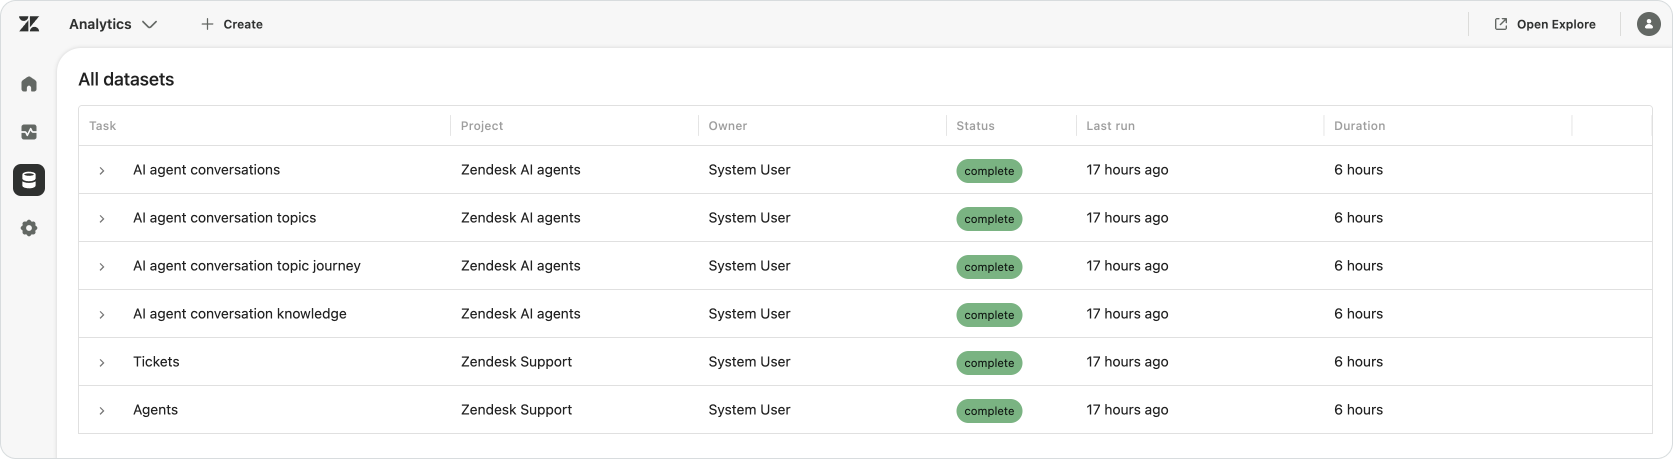
Agentic Analytics comes with predefined datasets for common reporting needs. Dataset builder also gives us Zendesk-provided source objects to use when building our own.
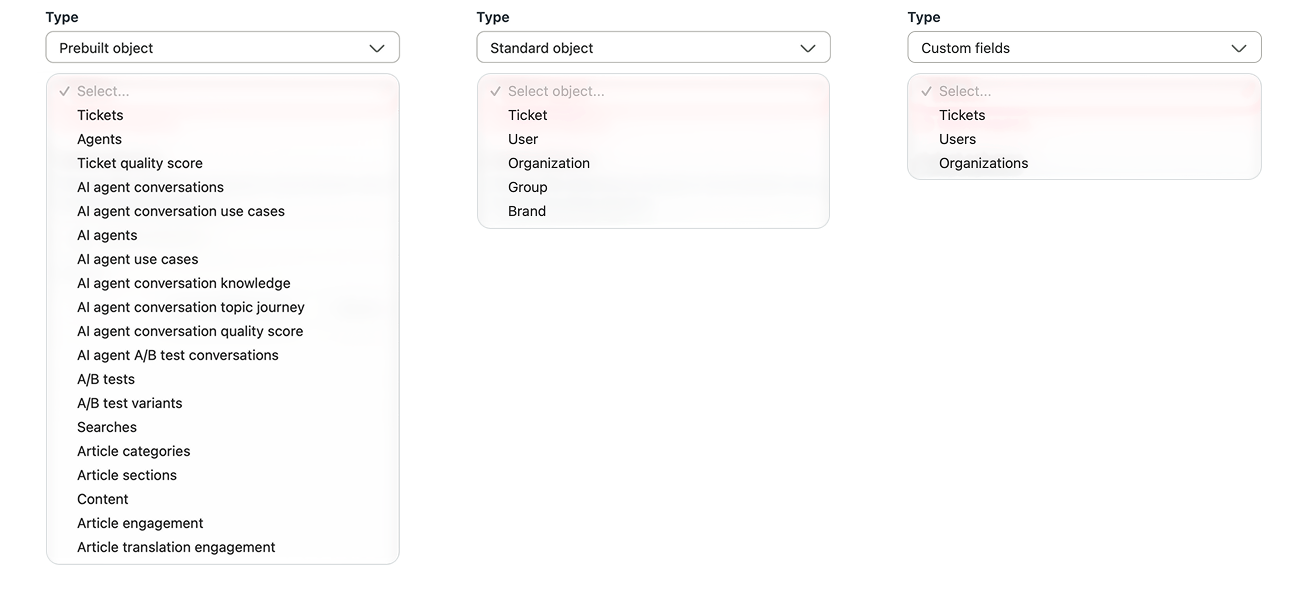
The prebuilt source picker covers Tickets, Agents and AI Agents, each with a set of defined elements we can use to handle most standard inquiries.
Custom datasets
Custom datasets let us bring information from different sources into one model for analysis. We can combine Zendesk's predefined objects with other standard objects, Custom Objects and custom fields, choosing the columns and relationships that describe the work we want to understand. The resulting dataset becomes a shared starting point for reports, rather than asking each person to reconnect the same information every time.
Standard objects gives us Ticket, User, Organization, Group and Brand. Custom fields can be selected from Tickets, Users and Organizations, while Custom Objects brings in the business records defined in your own account. We can start with what Zendesk already understands about service, then add the fields and relationships that describe our own process. The available sources will continue to develop, so start with the selection available in your account rather than assuming every part of the platform is already covered.
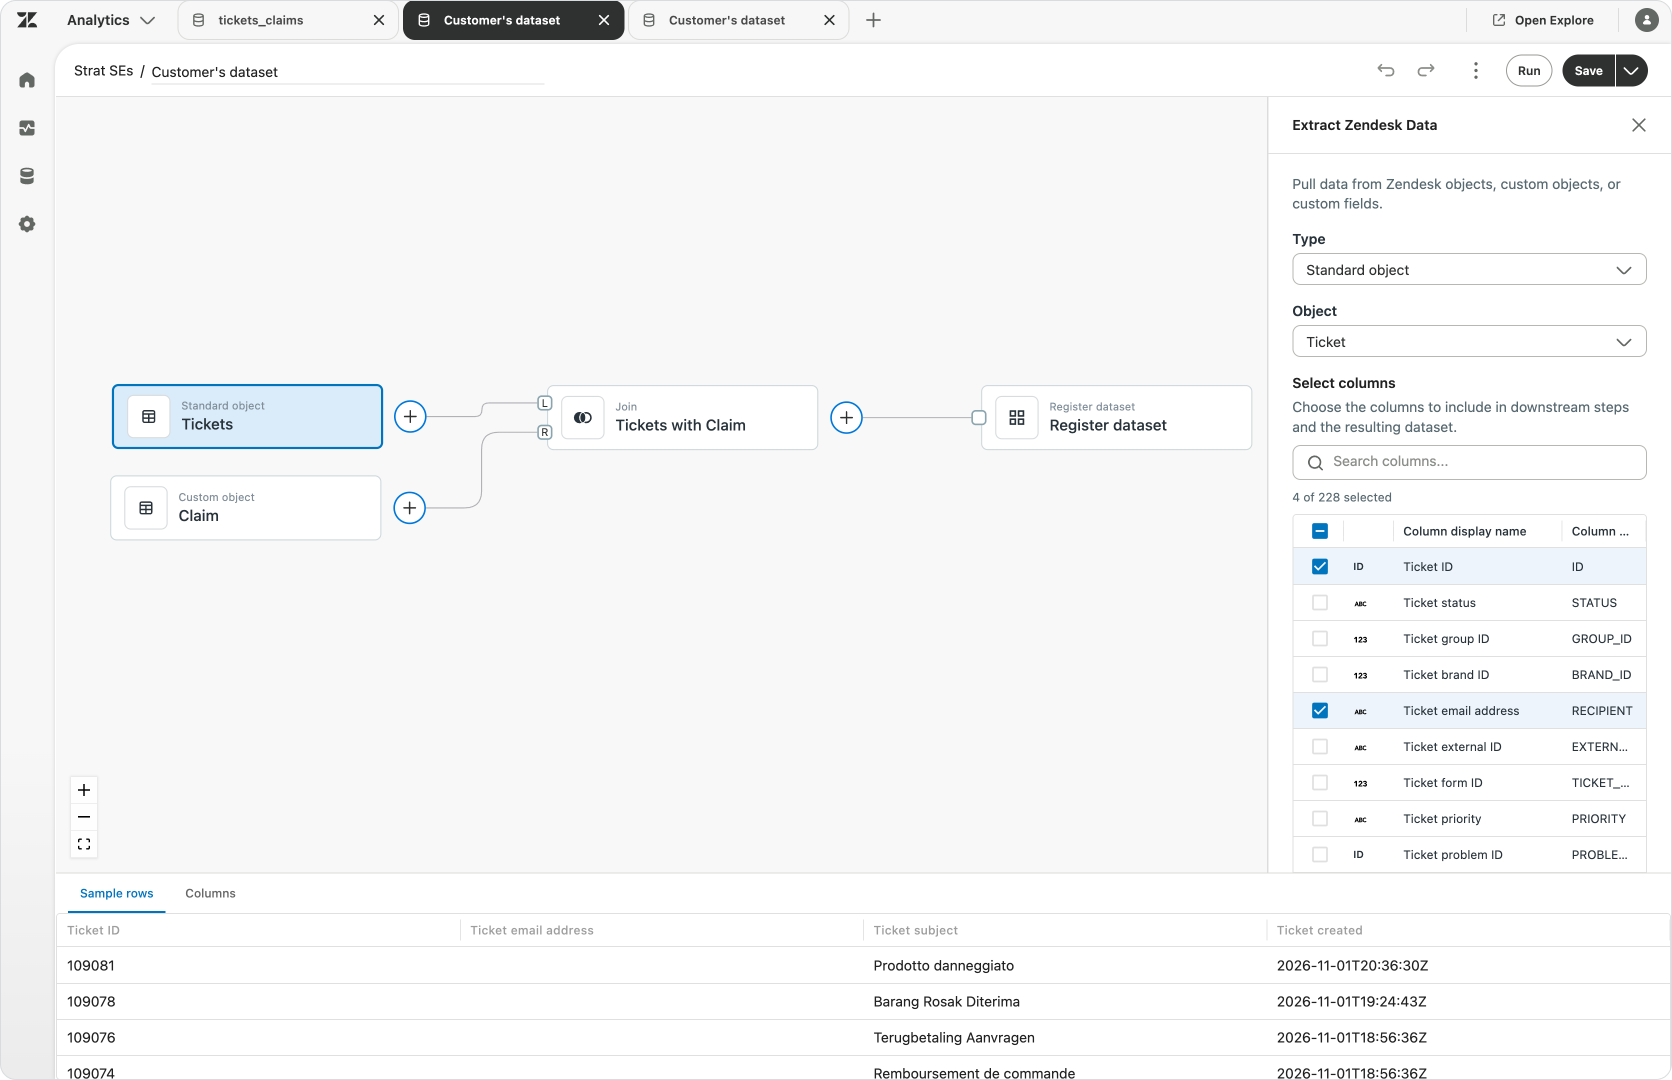
The dataset builder allows you to mix and match these datasets to fit your needs. Each source supplies a selected set of columns, and the connections describe how those columns flow into the resulting dataset.
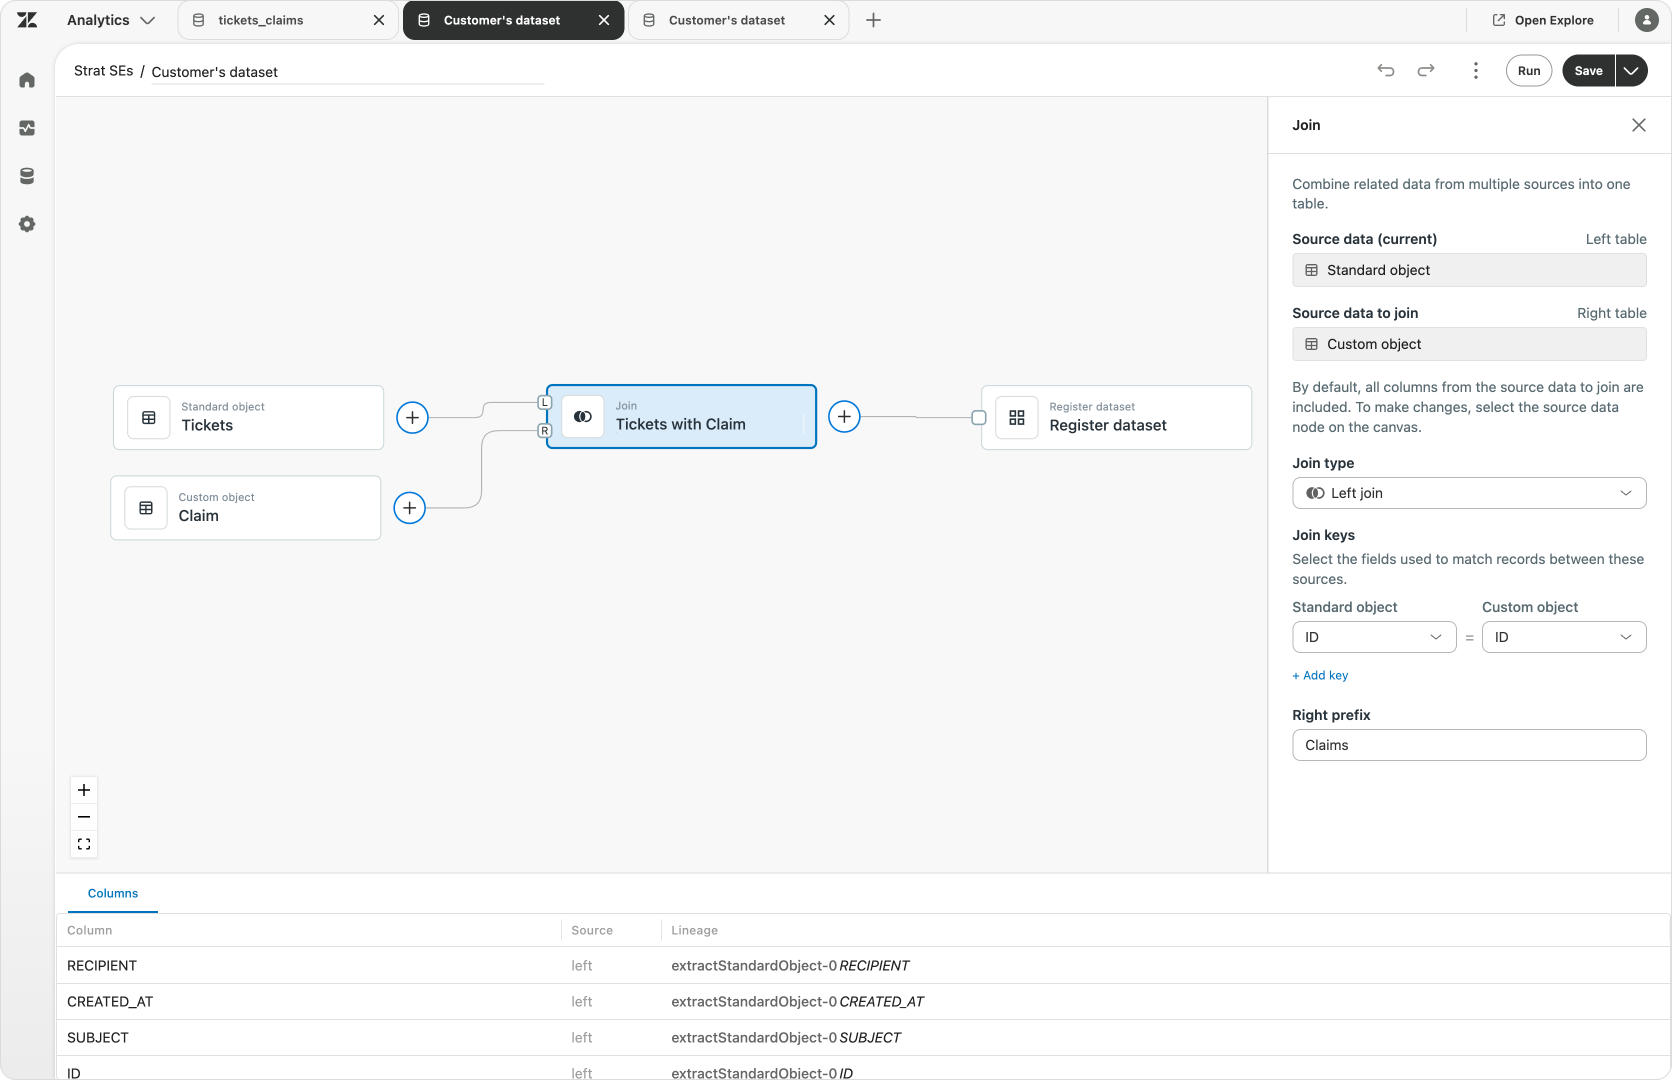
Join connects related sources into one table using matching fields and a chosen join type, like the traditional left and right joins, drops, inner joins, as well as options to rename items.
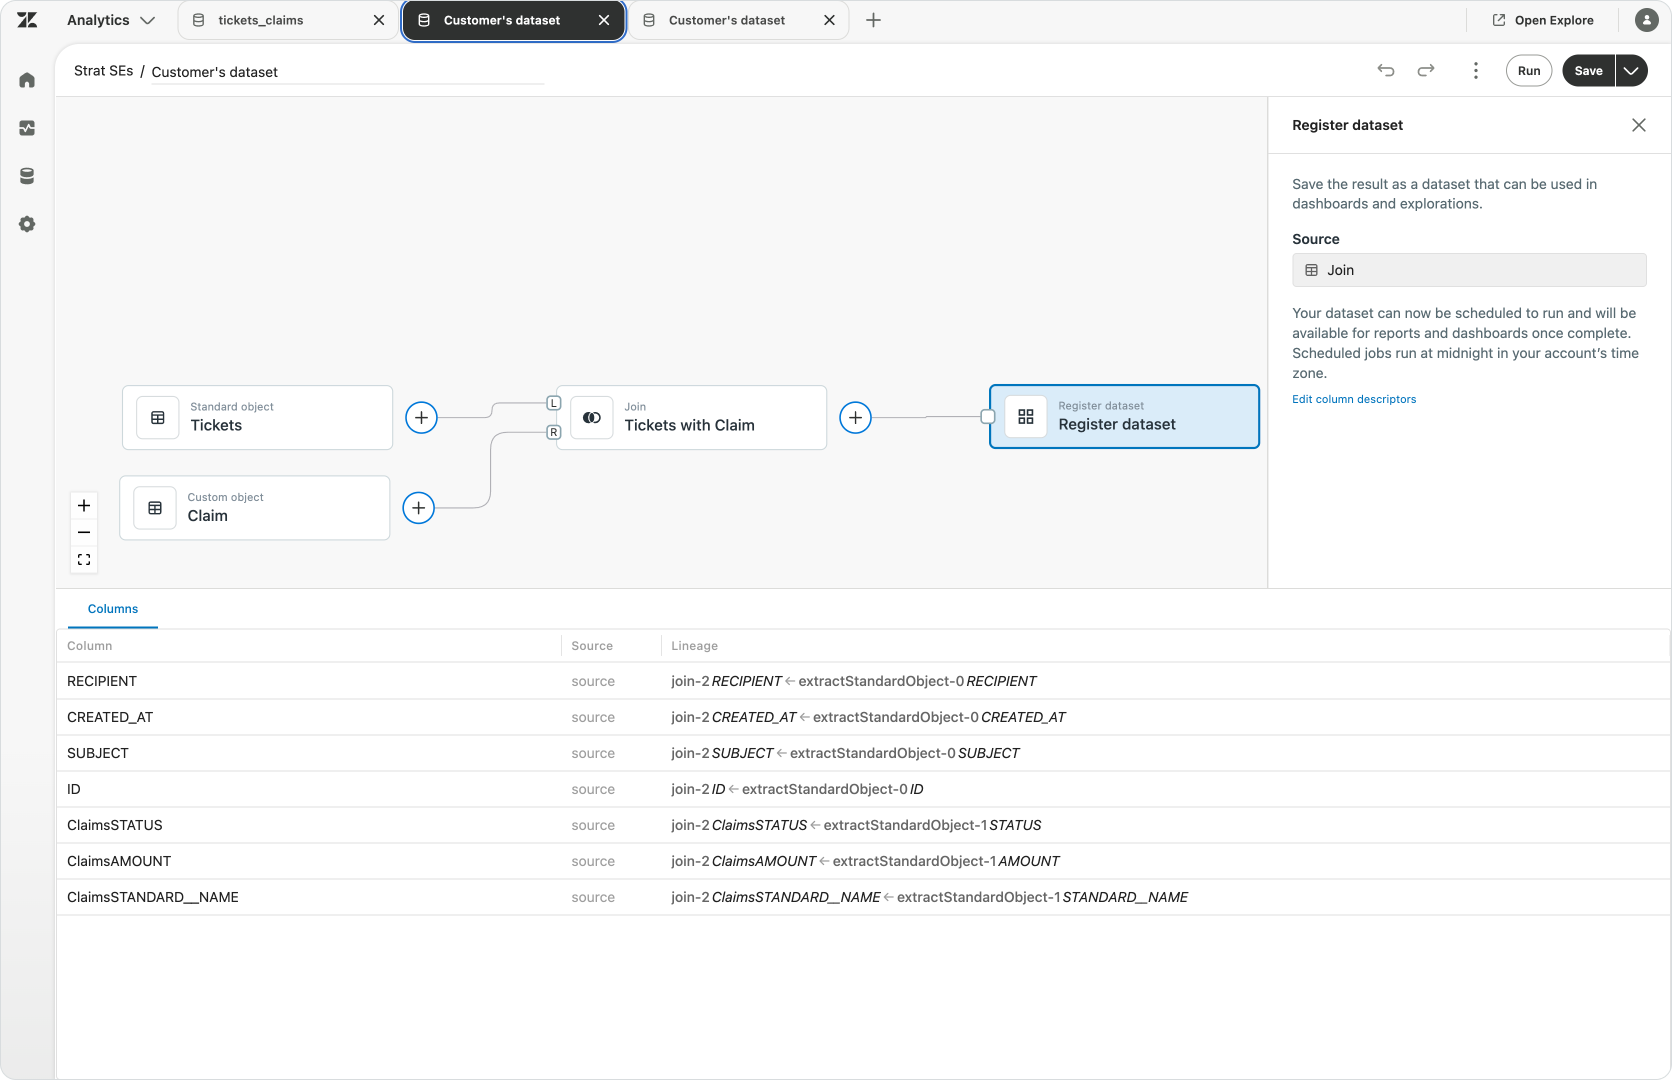
Once you create your data set you can register it, and make it available for Analytics to use. The registered dataset has a description explains what it covers, and it becomes available for reports and dashboards, and the data within it updates on a regular basis.
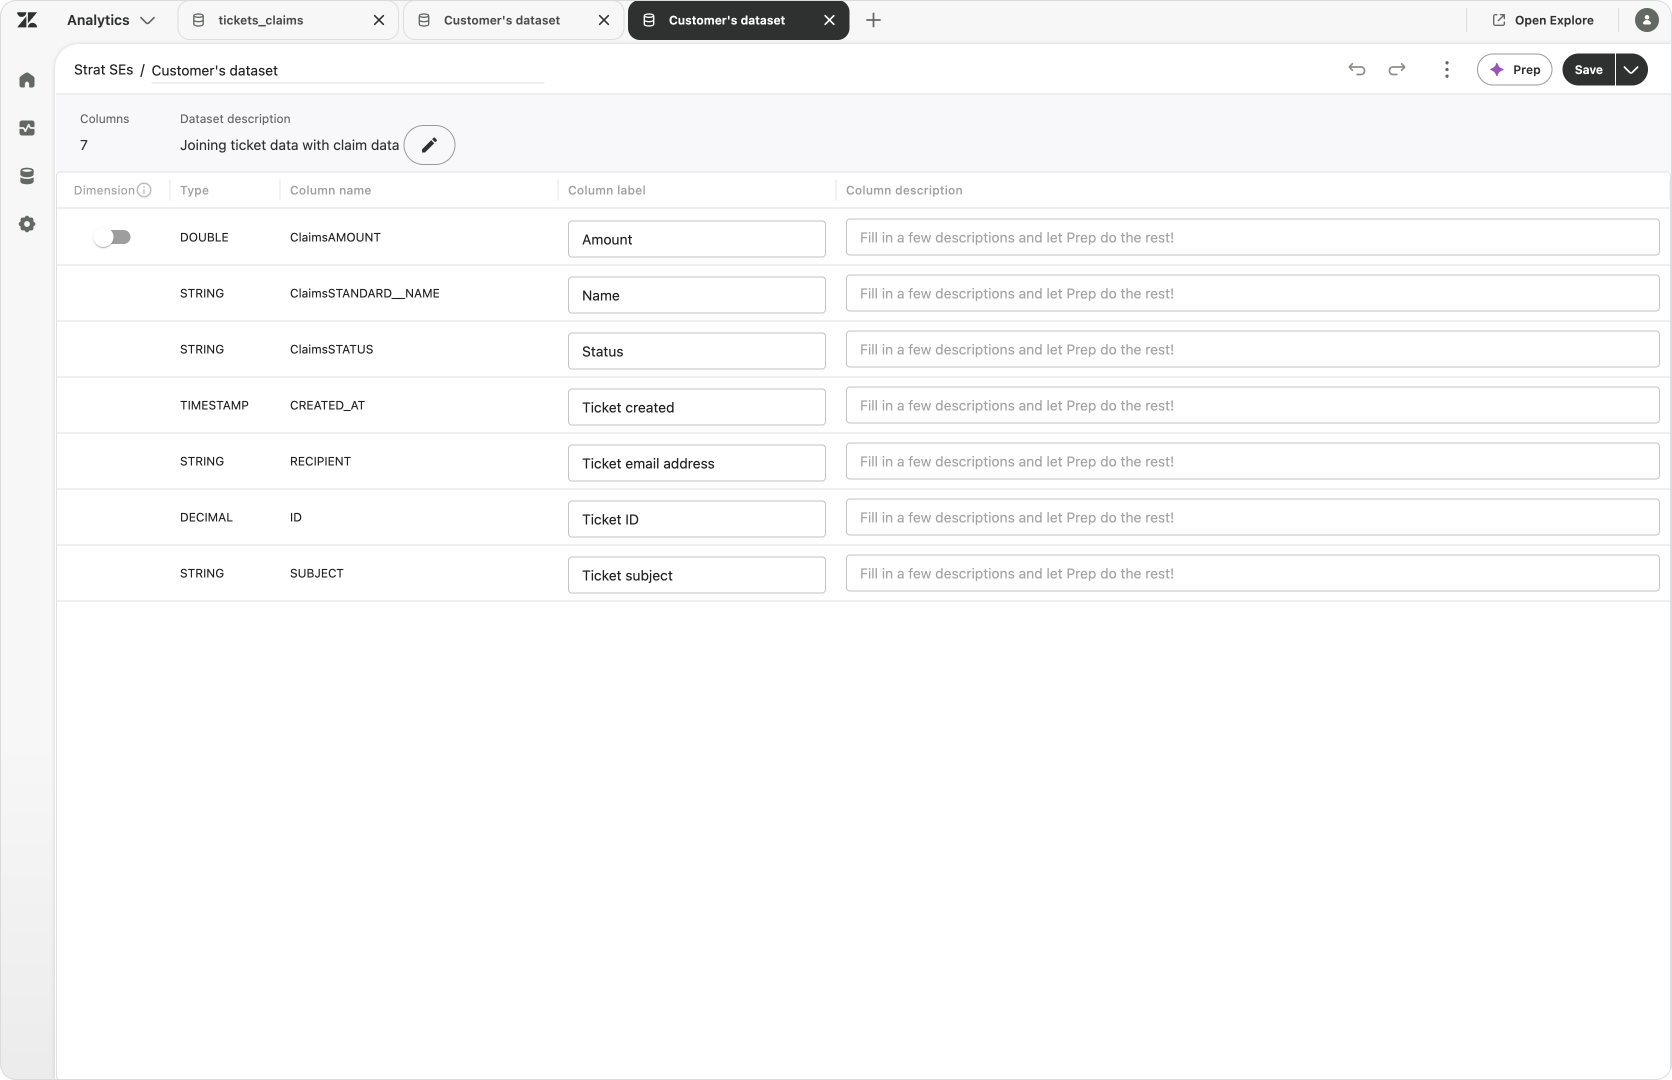
Column descriptors give the model a meaning that other people and the analytical assistant can use. It's these values that Agentic Analytics uses to understand the data at a semantic level. Alongside a useful label, a description can explain what a field represents, when its values are populated and what missing values mean.
Get the numbers
Reports and dashboards
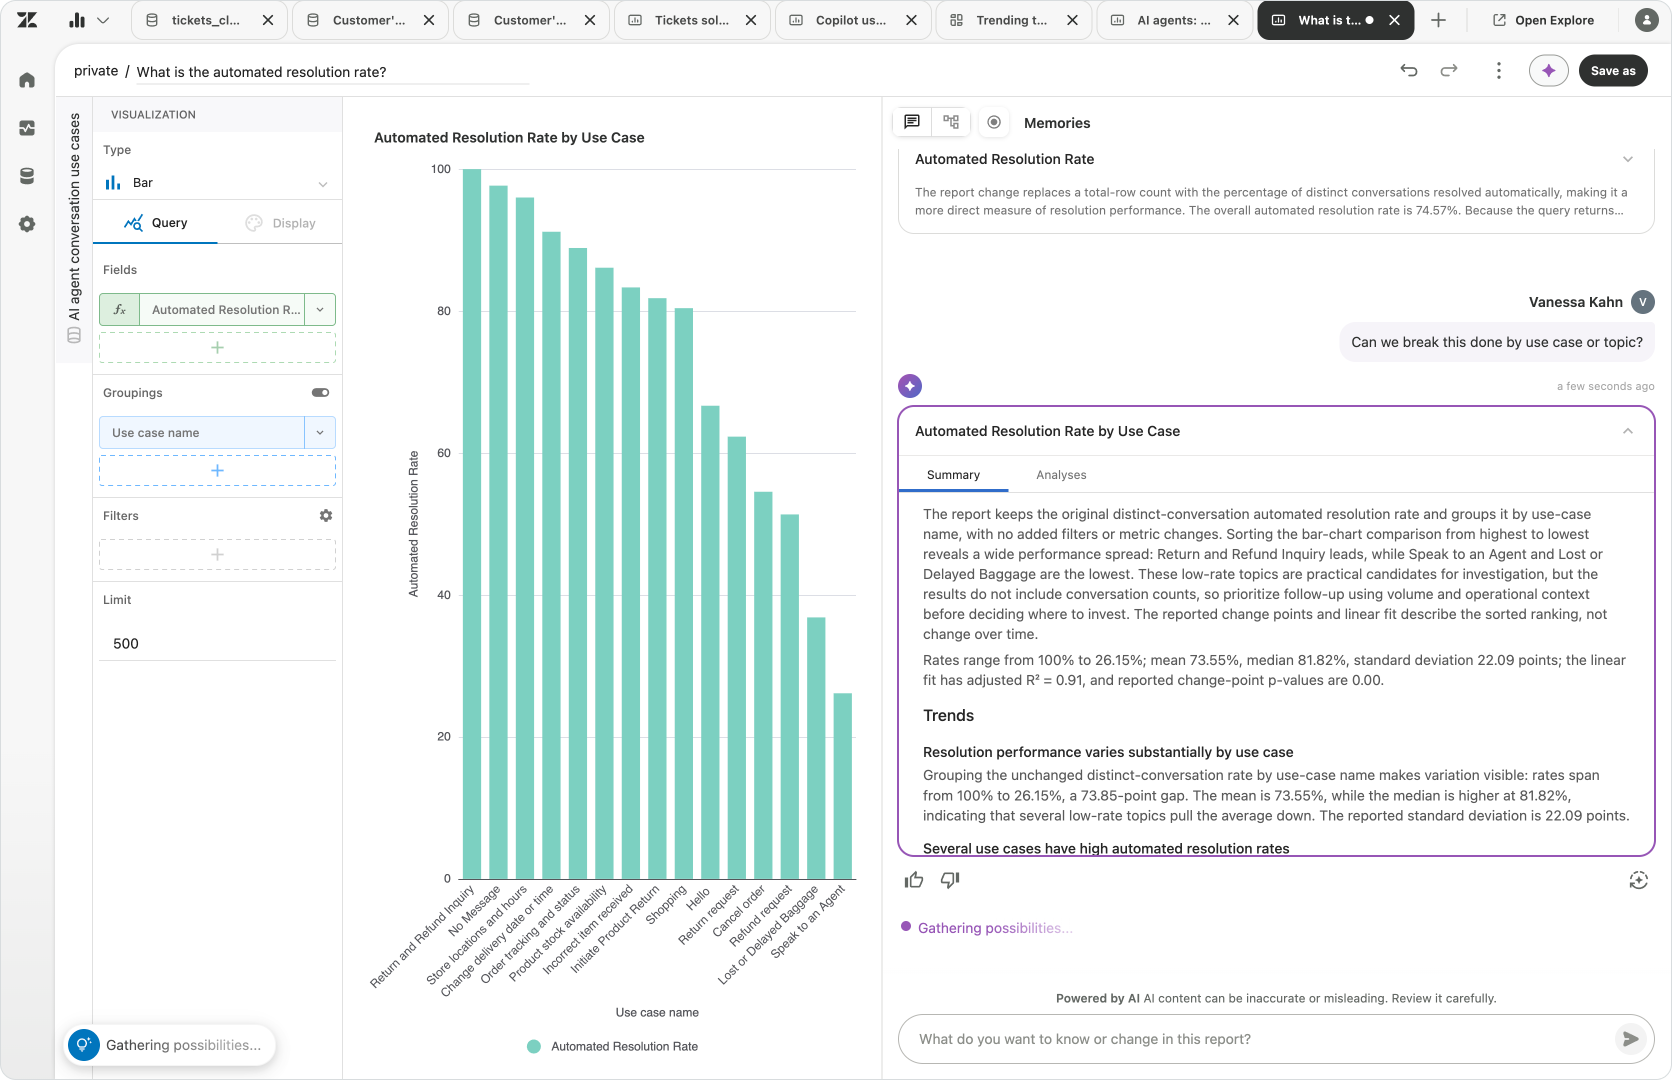
The starting point in Analyst Copilot is the question we have. We describe what we want to know in our own words, and its reporting experience brings back a report and an explanation, with relevant Memories linked where they add to the answer. We can ask about volumes, response times or a change we've noticed without first deciding which chart to build.
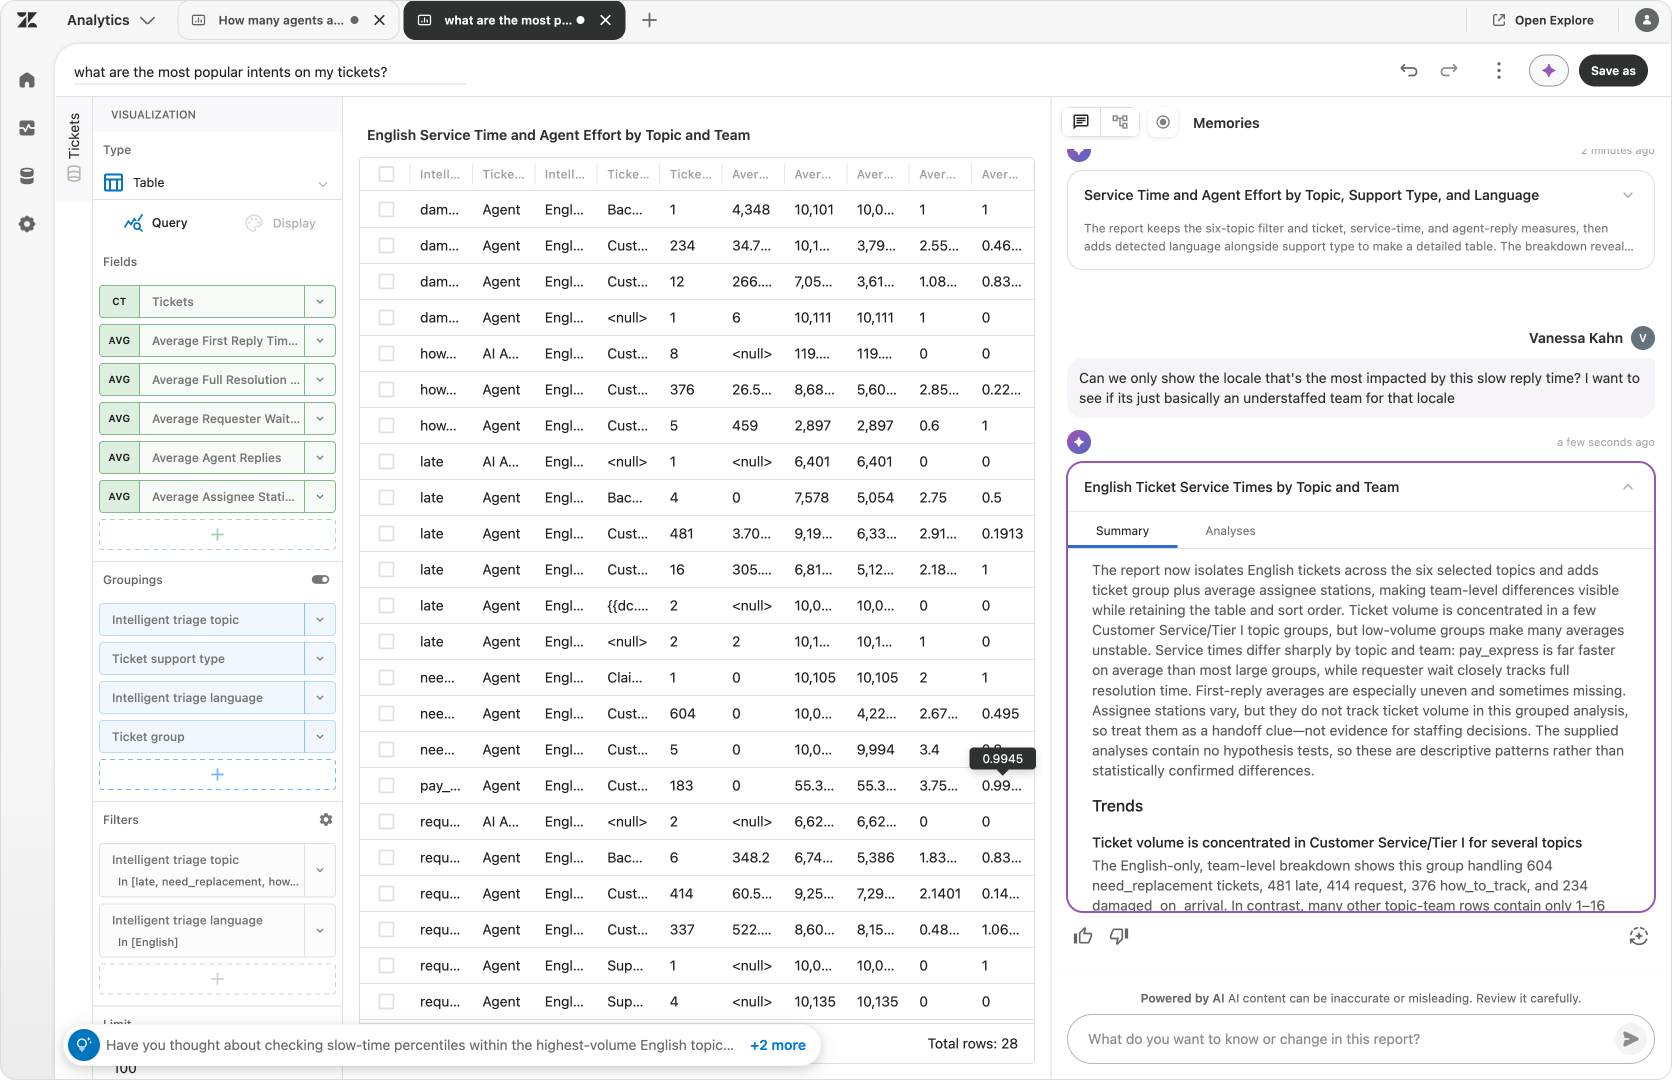
The conversation continues around that initial answer. You can request a comparison with an earlier period, a breakdown by group or a narrower selection of records. You build the report by talking to the data, seeing what comes back and deciding what to ask next. Useful views emerge as the system understands the question more clearly, and you can keep asking questions until you get the data or visual you need.
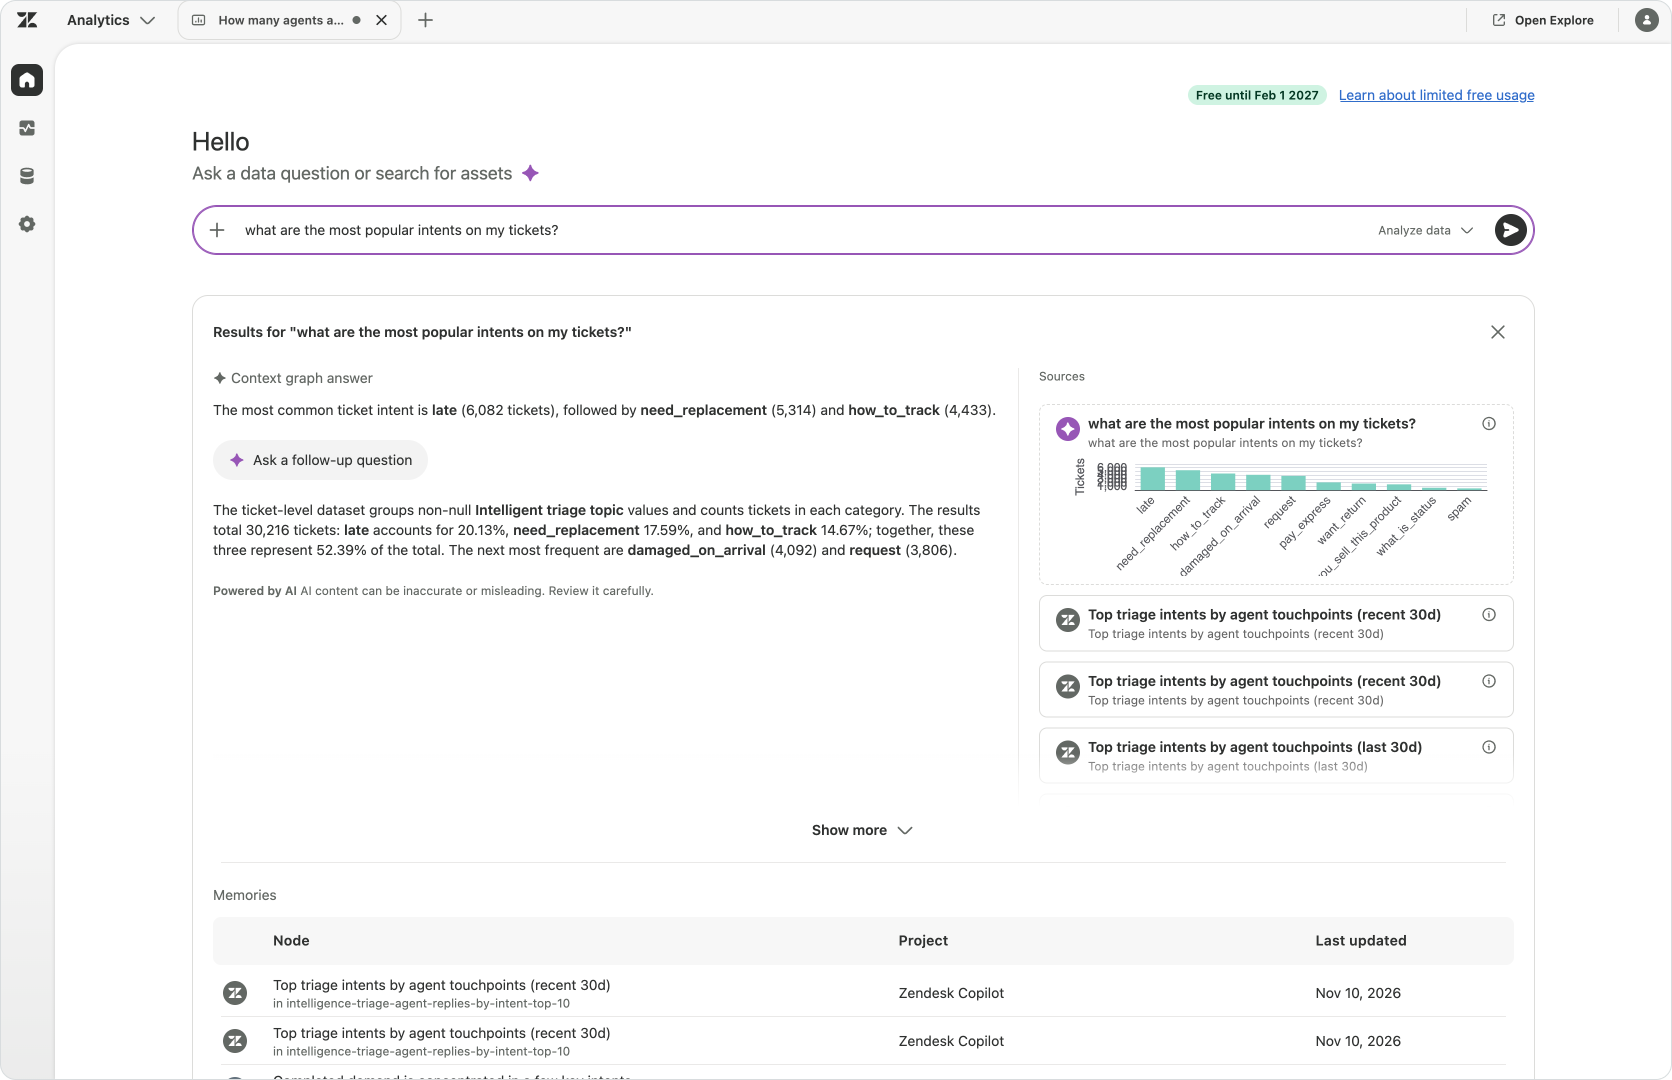
Any graph generated remains editable alongside the conversation. Measures, dimensions and filters can be adjusted directly when a view needs a precise change. The dataset, dates and selections you add yourself also become part of the analysis.
The field descriptions and business definitions we prepared earlier give those questions a more reliable foundation. Putting context into the dataset and having that retained analytical knowledge means we don't have to explain it from scratch in every prompt again. Here too, we see a benefit compared when talking to a more generic AI Assistant that looks at just the raw data exports.
Useful reports can become part of a dashboard, giving your team a saved view to return to after the conversation ends. A dashboard brings related reports together with filters and explanatory text, so the reader can see both the graphs and the context needed to interpret them. A dashboard can be saved into a project or can be shared or exported, while the individual reports remain a starting point for further investigation.
So in the end we still have dashboards, but they no longer need to be the beginning and end of the work. A conversation will produce the views we need, but a dashboard can keep the useful ones together as a starting point for new investigations.
Understand what the numbers are telling us
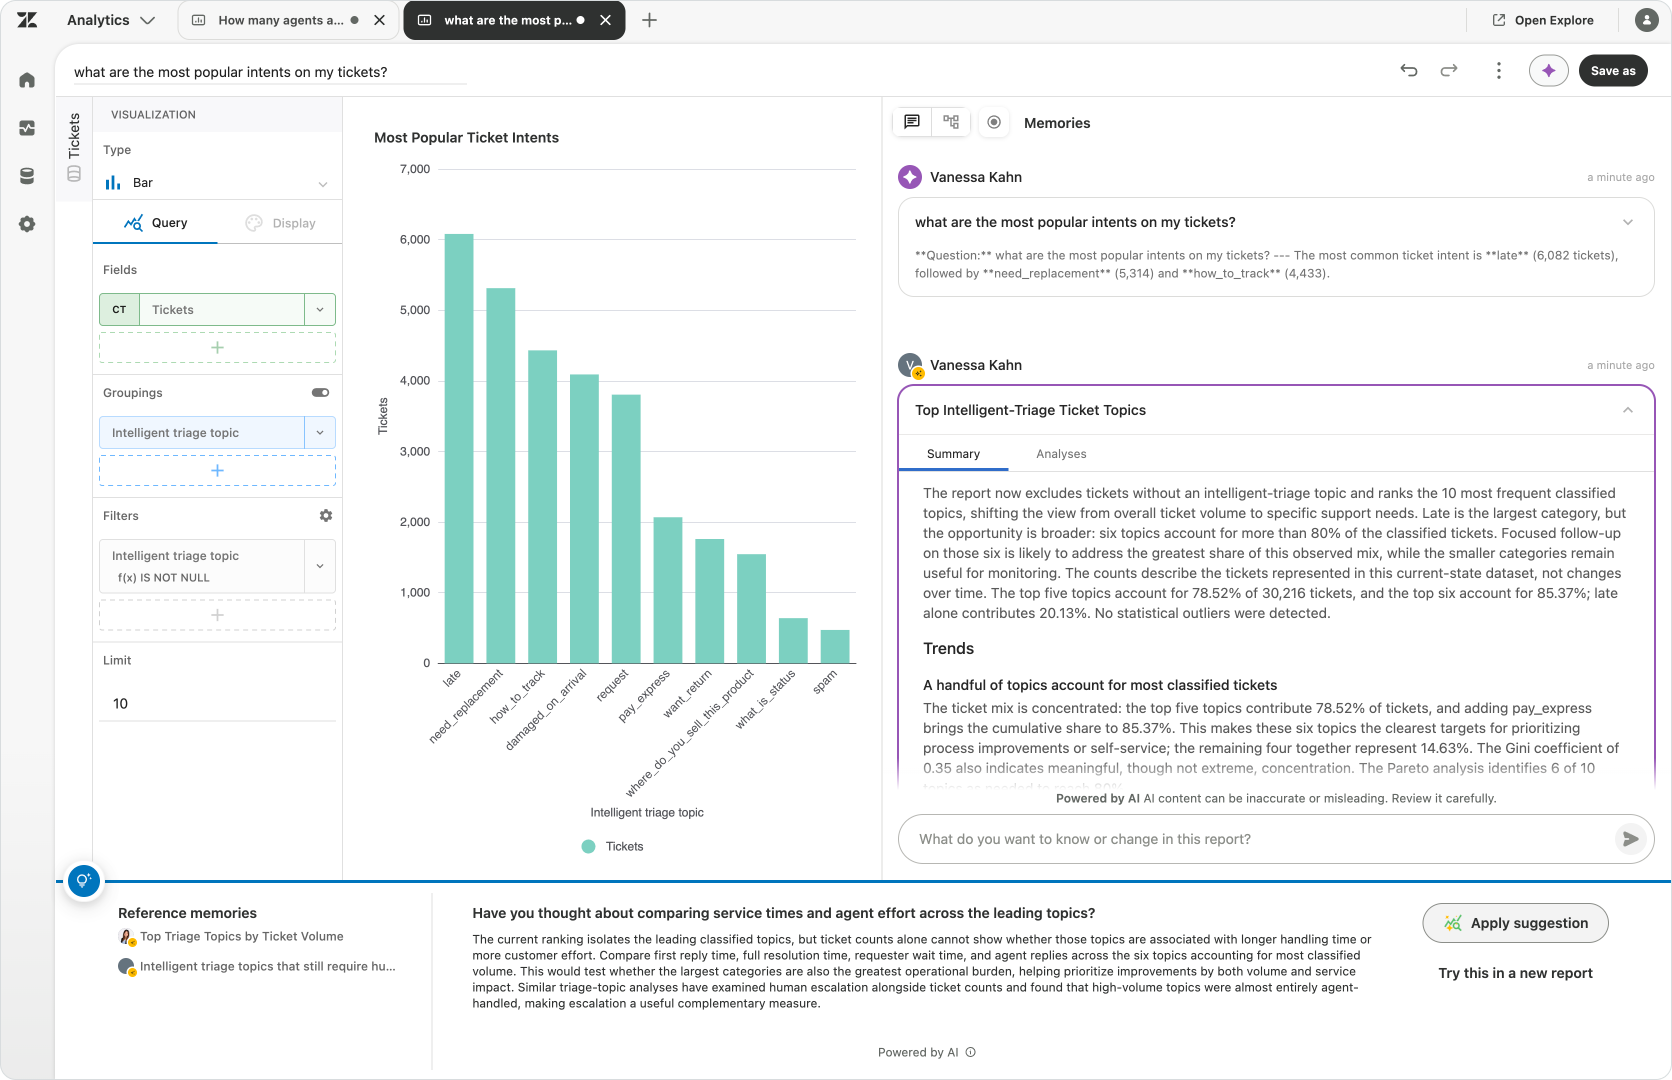
Analyst Copilot creates reports on the fly and lets us explore which actions contributed to a change. It can compare affected groups and follow the analysis towards the relevant conversations. Relevant Memories connect an answer with earlier analytical context, making its definitions and assumptions easier to inspect.
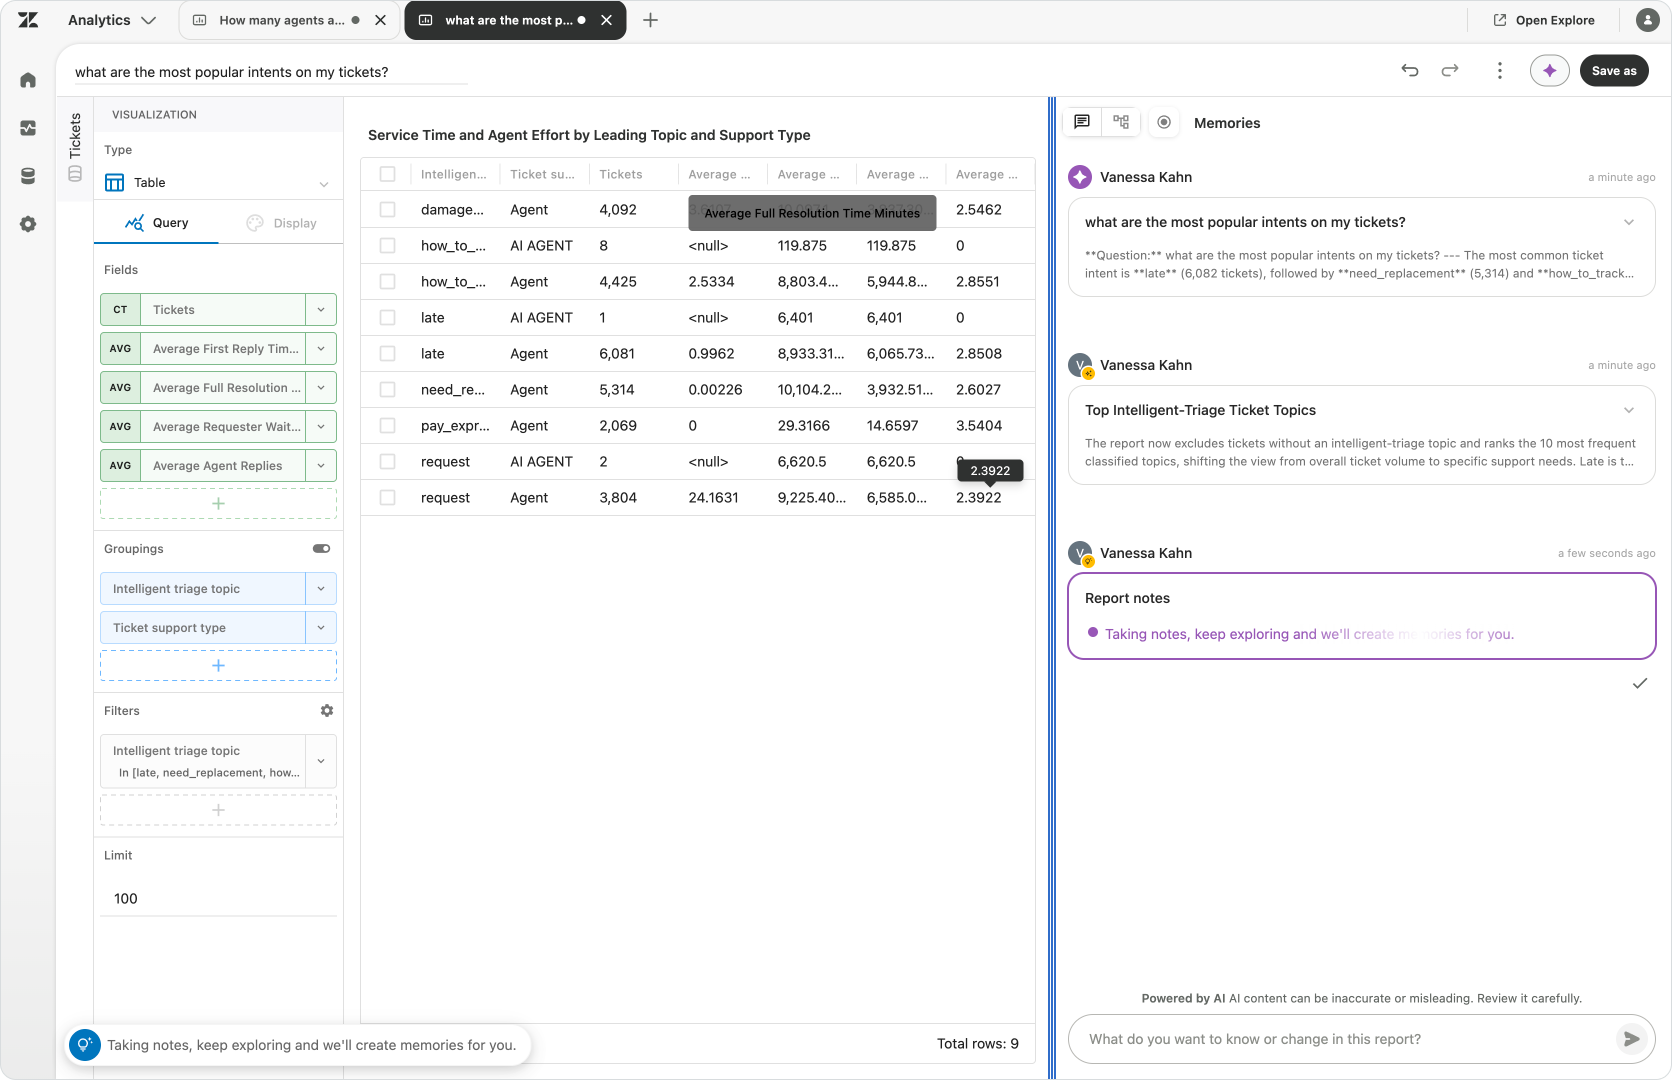
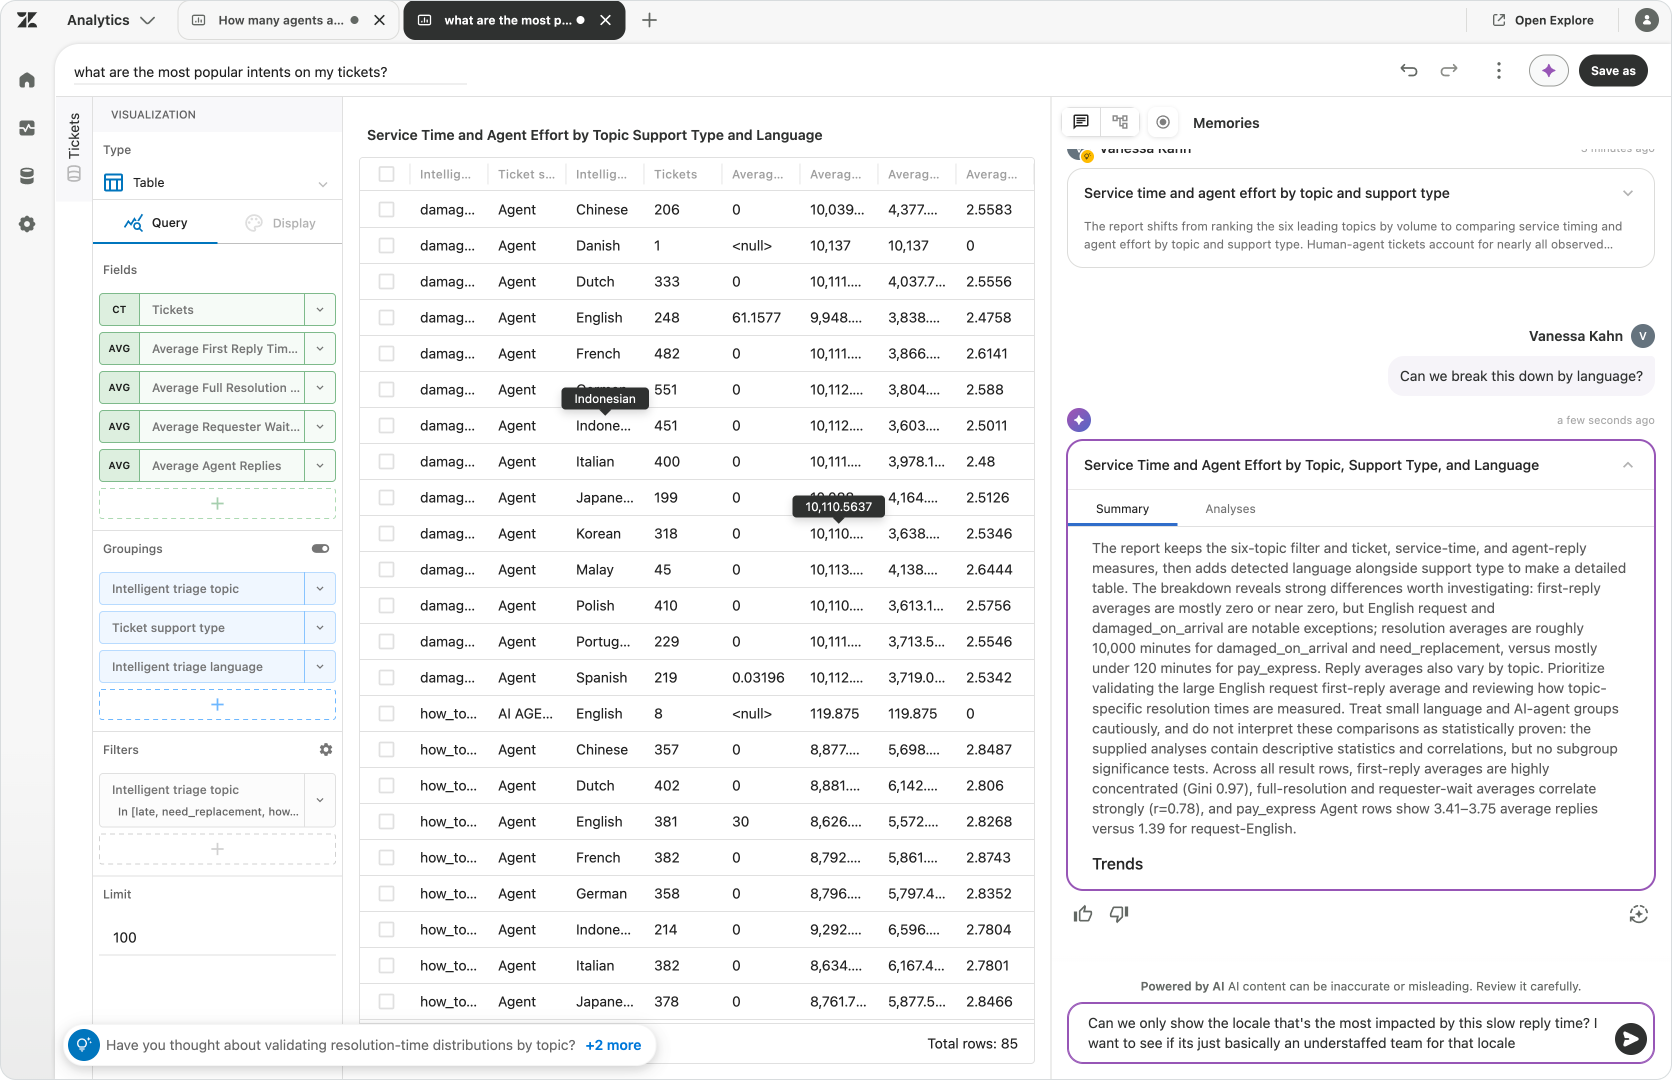
Memories
As we investigate, we start to discover the relationship between all the elements that contributed to an outcome. An admin might already know which field contains the values we need, while a team lead understands the process exceptions those values represent. But thanks to memories one member can build on the investigation and knowledge of another team member, making their logic available to others. So instead of investigations disappearing once you've found your answer,, the next person can now pick up on that tread and no longer needs to reconstruct the same logic when asking a related question.
Memories in Analyst Copilot retain analytical steps, filters, business logic and preferences as people work. Useful findings and definitions become context for later investigations, so a related question can start with an agreed measure and the field recording its outcome.
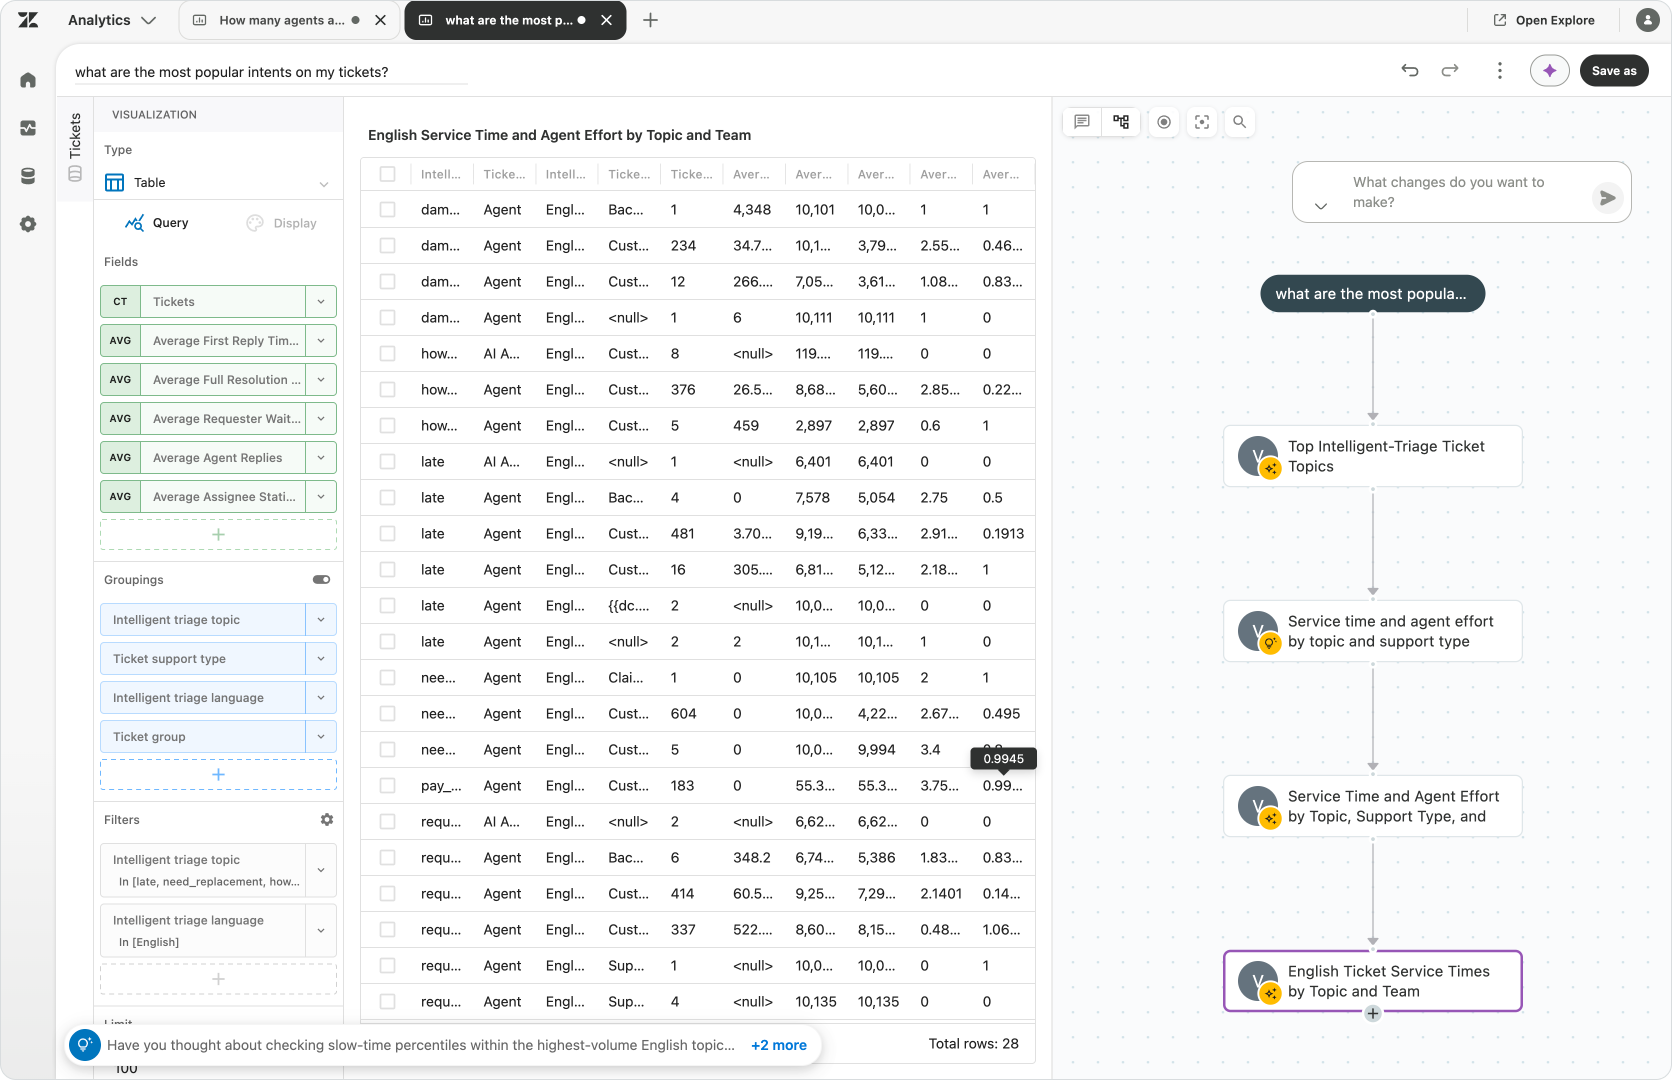
Context Graph
The Context Graph, part of the conversational UI, shows how the retained steps, metrics and findings relate to one another. While the conversational view lets us read the investigation as a sequence of questions and answers; the Context Graph makes the analytical paths visible. Both help us revisit a useful step in an investigation and continue with a new related question.
If two teams reach different conclusions to the same question, they can can use these to compare their filters and definitions instead of arguing over the final number. One may have included every conversation while the other counted only automation-eligible requests. Seeing that difference helps people understand which question each analysis actually answered.
Decide what needs to change
Understanding the cause doesn't automatically tell us which change is appropriate. If the AI Agent cannot answer a question because the information is missing, we need to improve the knowledge. If the answer exists but the process sends the request to the wrong place, we need to inspect the configuration. If customers are following the intended steps and still waiting days for approval, the process itself may need to change.
But even if the process is well defined, things might go wrong. Being noticed of problems, knowing what's going on now and being able to dive into these events, is the basis for knowing if somethings should be changed.
Alerts
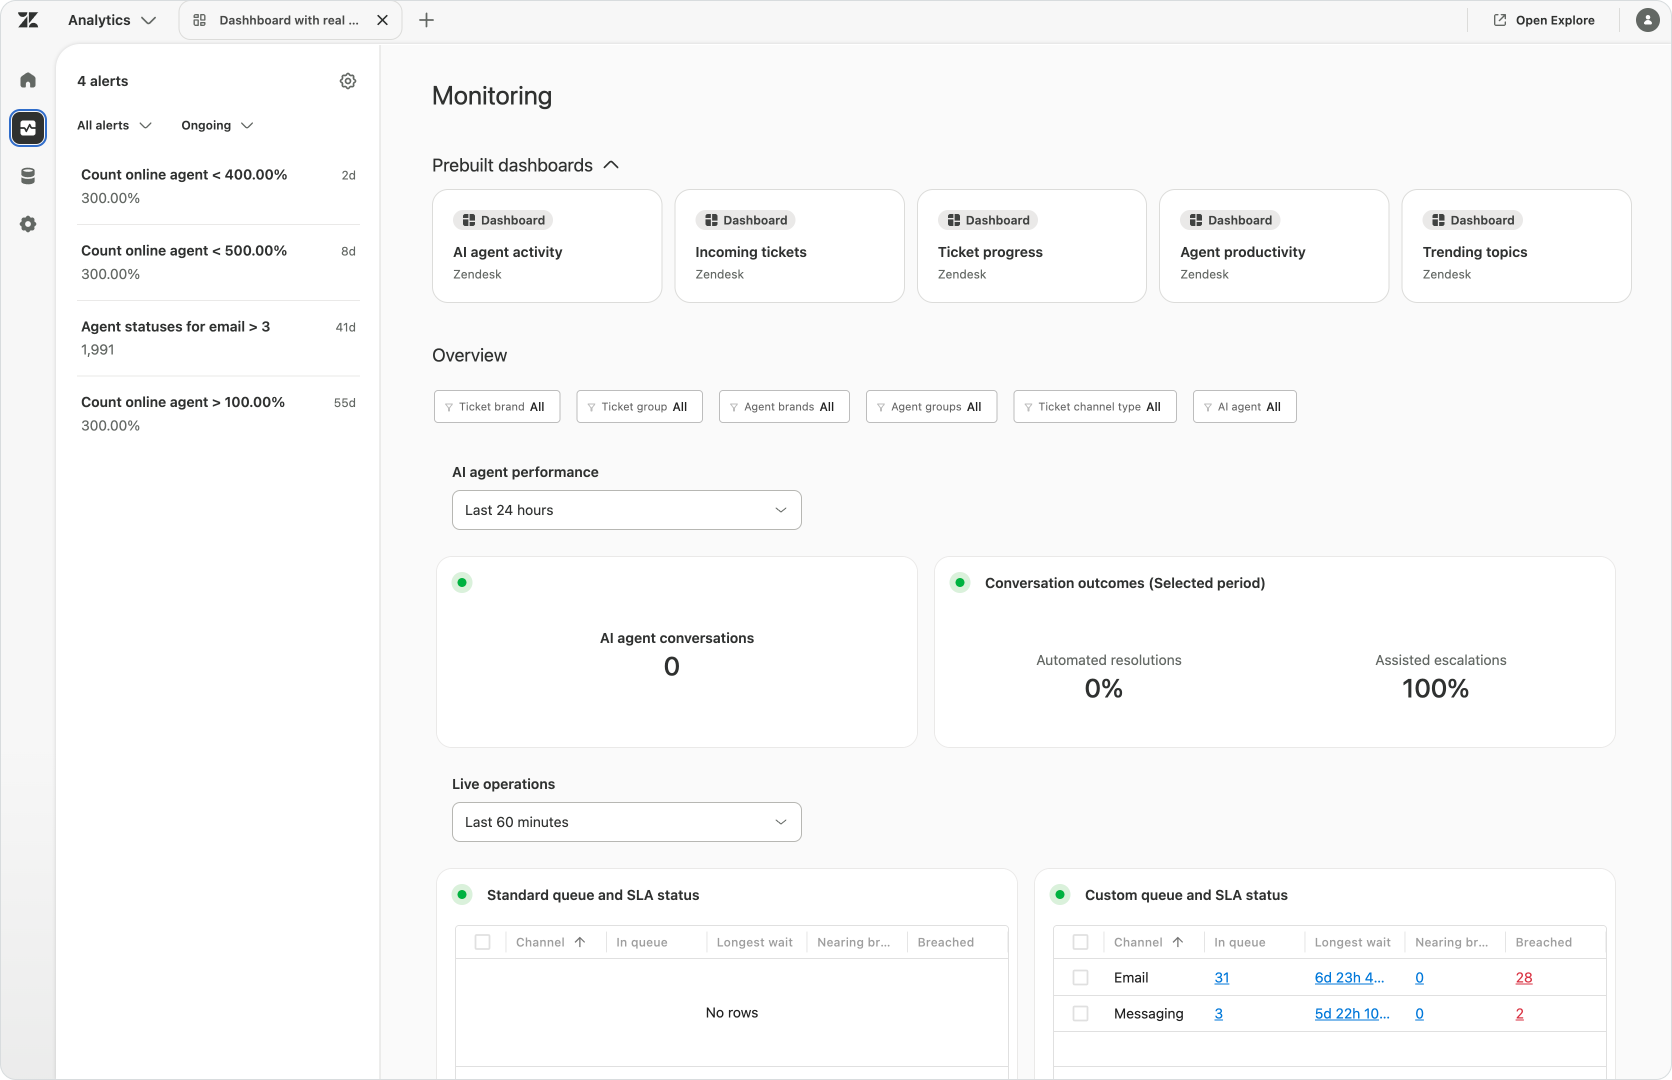
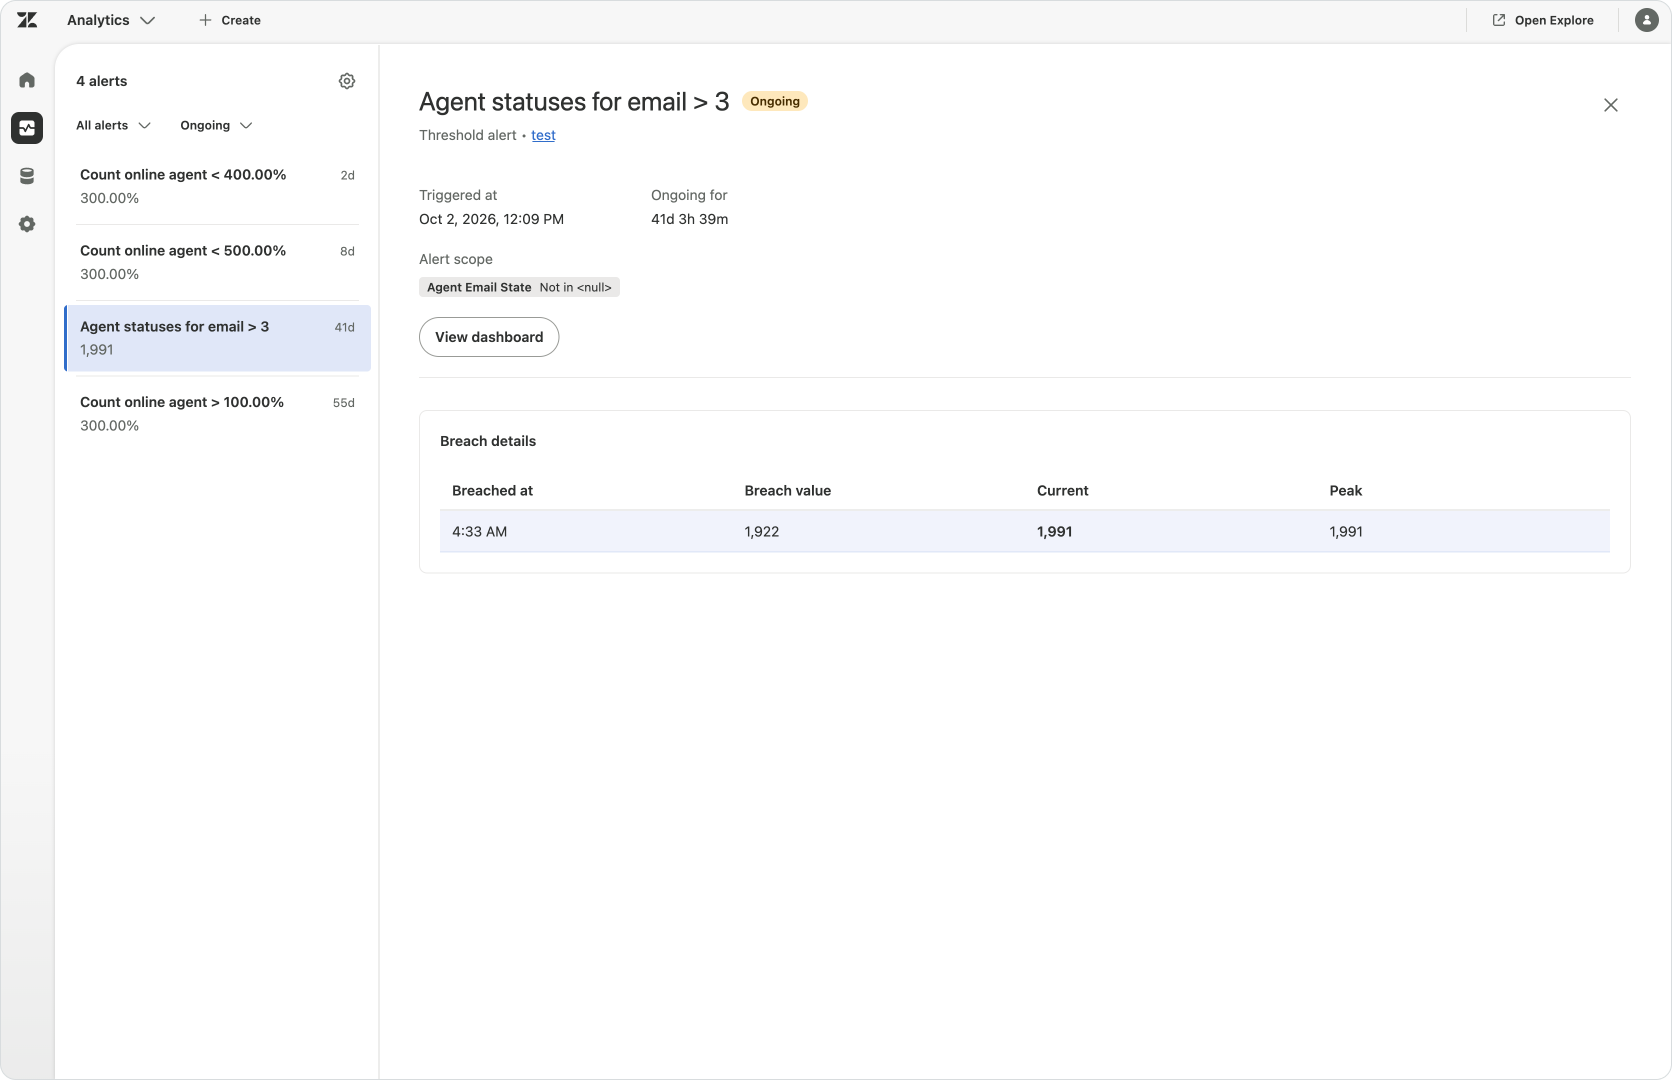
Alerts in Agentic Analytics can bring unexpected outcomes to our attention without requiring someone to keep reopening the dashboard. They monitor specifc dashboard measures against a chosen threshold, and deliver notifications by email or Slack channel.
Notifications link back to the dashboard context for investigation. The notification itself not establish its cause or suggestions to fix the process; it gives the people responsible a nudge to look at the data.
Real-time dashboards
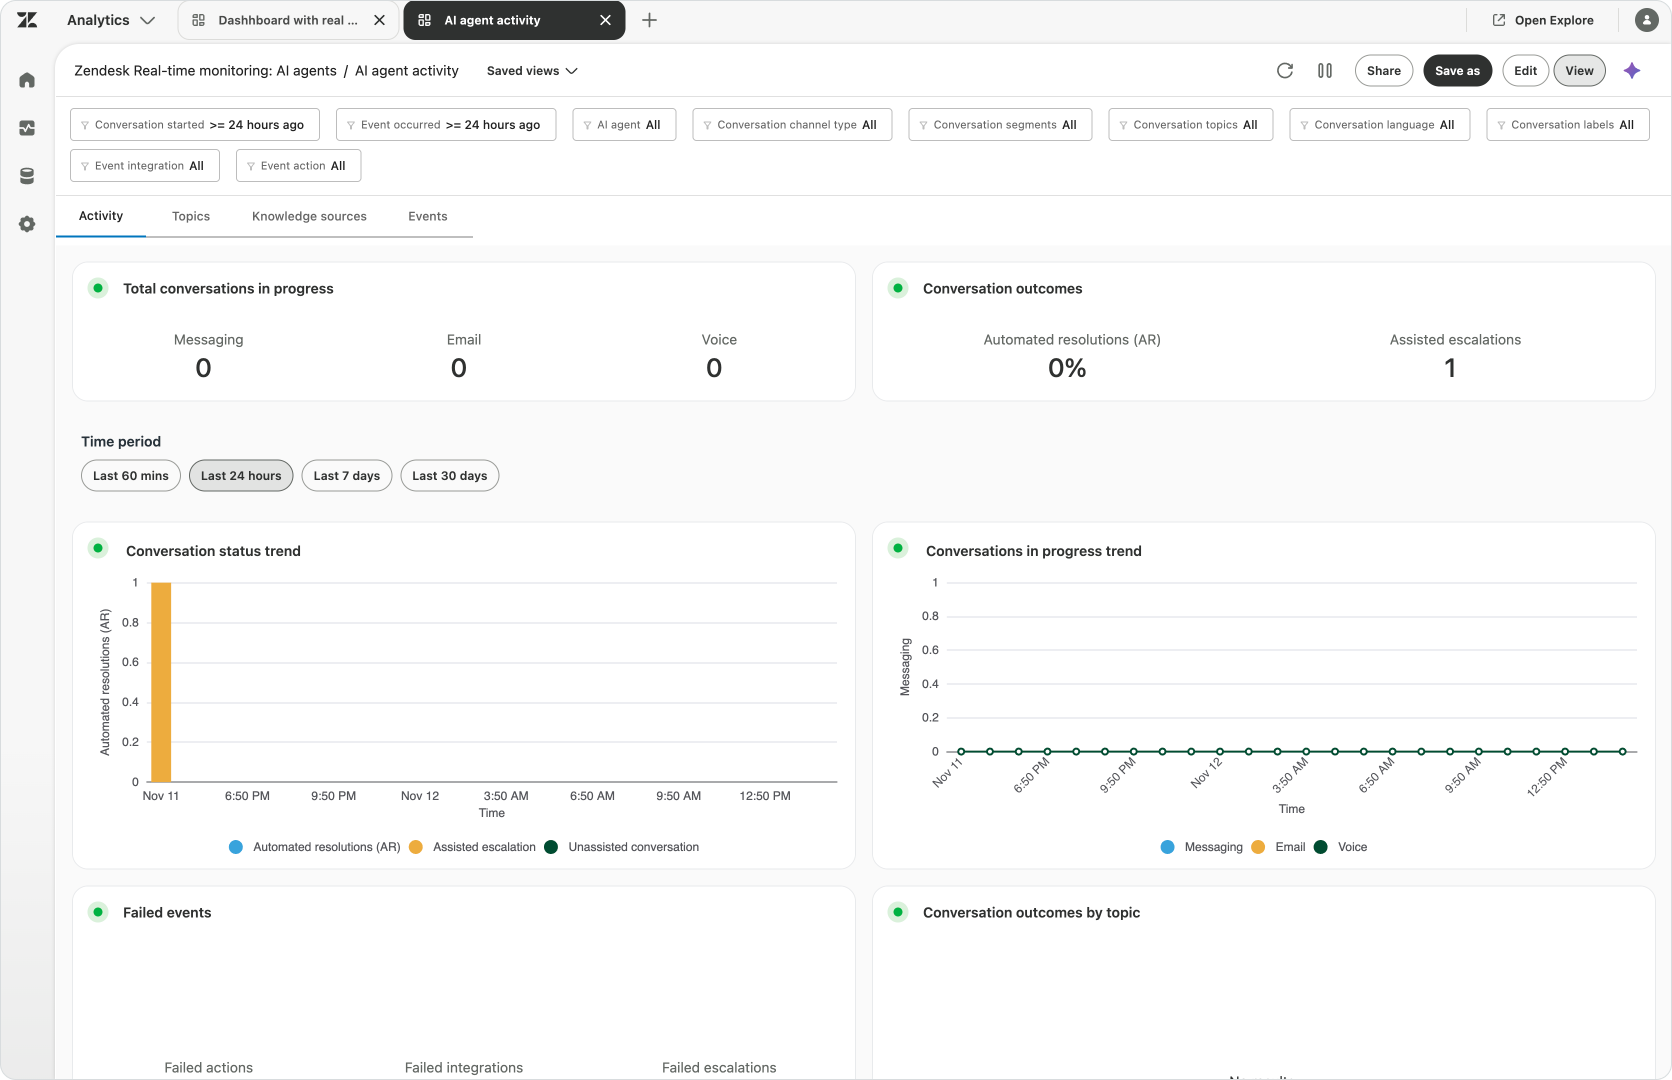
Real-time monitoring gives us a live view of operational data in Zendesk’s real-time datasets: tickets waiting in queues, response and wait times, and your team’s availability and capacity across channels. A team lead can build a dashboard around the queues and groups they’re responsible for, see where work is building up and decide who can help. The data updates within 5–10 seconds, while the dashboard refresh can be adjusted or paused to inspect a change more closely.
Learning Loop
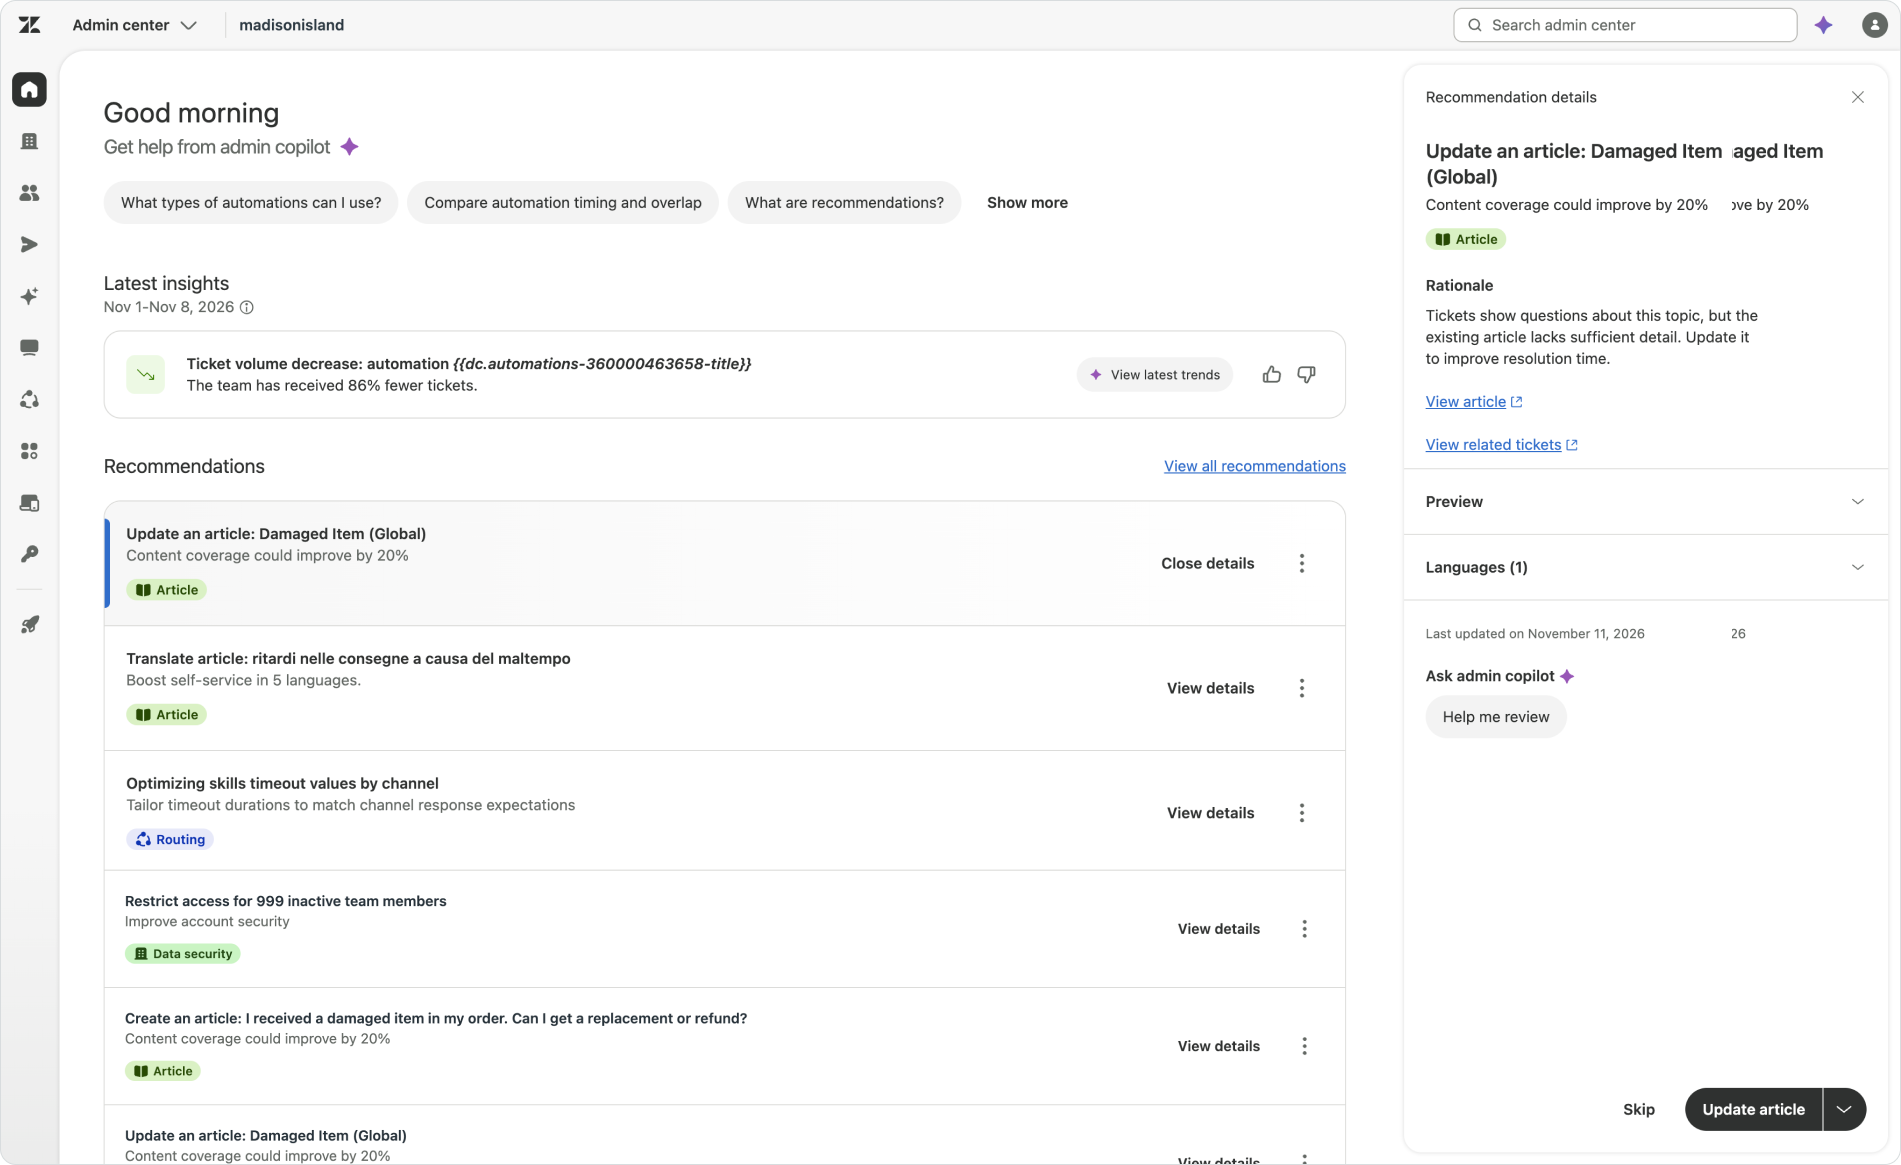
Now that we know what happened and what might need to change, we can leverage Admin Copilot to implement that change via a similar conversational experience. We can input the insights we got from Agentic Analytics, and tell it how we want to adapt our setup. Admin Copilot helps us investigate the best way to make those changes, with a preview for the admin to review and approve.
At AI Summit, Zendesk showed an even more connected version of that handoff. Admin Copilot directly used past conversations insights from Agentic Analytics to propose changes. An admin could review the reasons for each change, accept or decline them, and test the procedure against historical conversations before approving deployment.
Admin Copilot's own insight can flag specific metrics, while its proactive recommendations identify opportunities such as unused business rules, routing adjustments or macro improvements. Similarly it can recommend procedures, or modify knowledge articles.
Analyst Copilot can let us understand what happened, Admin Copilot provides configuration recommendations based on those events and Alerts draw attention to measures that need our attention. Together, these capabilities form part of Zendesk’s Learning Loop where each outcome gives us the insight for the next one.
 Thomas Verschoren

From a number to a better outcome
Agentic Analytics connects the dots between solved tickets, proving outcomes and learning from what happened.
Datasets bring the relevant service and business records together into one platform. Conversational reporting produces the numbers and views needed to explore a question, and makes the investigation needed to interpret those results that much easer, while Memories keep useful work available for the next question. Alerts and recommendations bring attention to changes, and the finding gives us a clearer basis for deciding whether the fix belongs in knowledge, configuration or the process itself.
An outcome based platform needs evidence to show you its results. But it also needs to guide you towards those outcomes. That is where Agentic Analytics fits into the AI Summit story: it gives more people access to the service and business context behind the outcomes, and a practical way to investigate what to adapt next.